Analytics
The Analytics tab is a per-agent performance dashboard.
Navigating to Analytics
Open an agent, then click the Analytics tab. Switch between 7D, 30D, and 90D ranges.
What You'll See
- KPI strip — conversations, leads captured, capture rate, average response/first-token latency, and fallback rate.
- Conversations over time — an area chart of conversation volume across the selected range.
- Lead score distribution — hot/warm/cold counts, tied to Flow Builder's scored answer options.
- Top asked questions — flags unanswered "knowledge gap" questions, with a shortcut into the Knowledge tab to fill the gap. (Question clustering is a planned Phase 2 feature — this section may show a placeholder if there isn't enough data yet.)
- Token usage — input/output/cached tokens and cache hit rate.
- First-token latency — average and p95, against target latency.
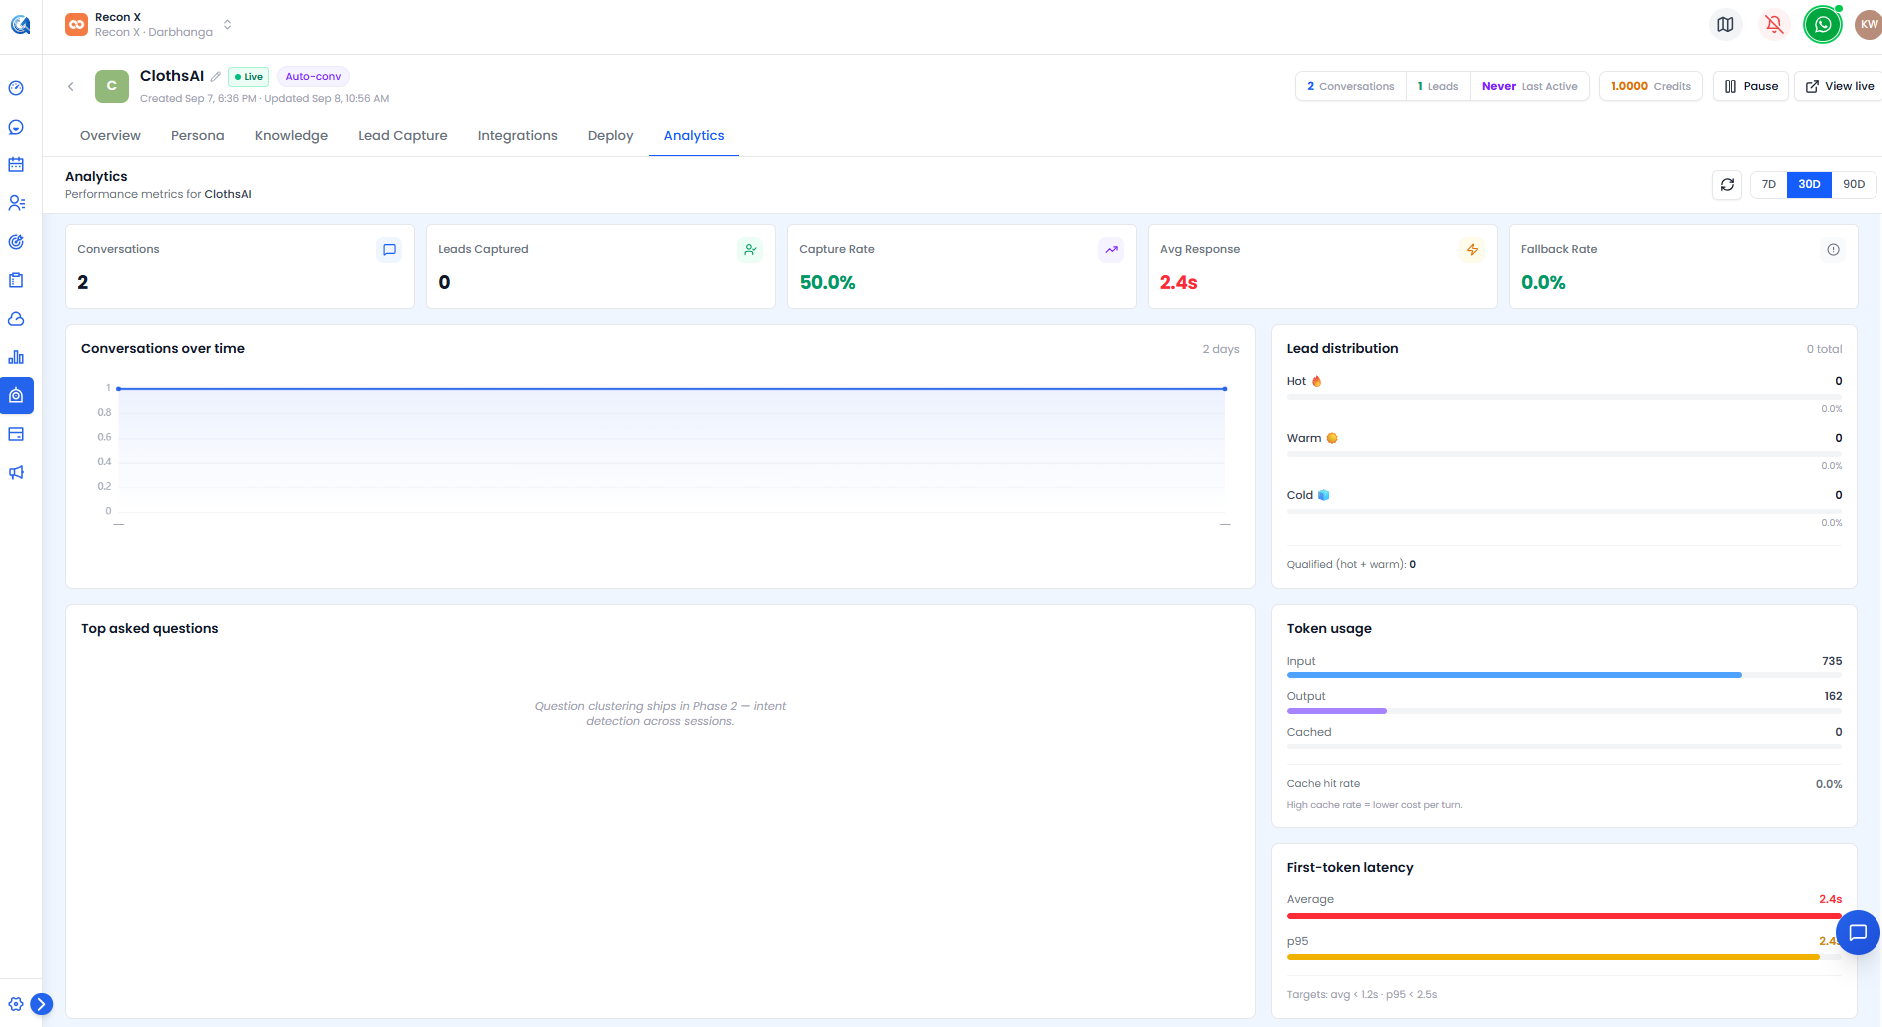 The KPI strip, conversations-over-time chart, and lead score distribution for a 30-day range.
Video Walkthrough
Watch the complete walkthrough below.