Calendar Section
The Calendar row on the Dashboard shows appointment volume over time, giving you a day-by-day view of booking activity within the selected date range.
Daily Volume Chart
A bar chart displaying the number of appointments booked per day across the selected date range.
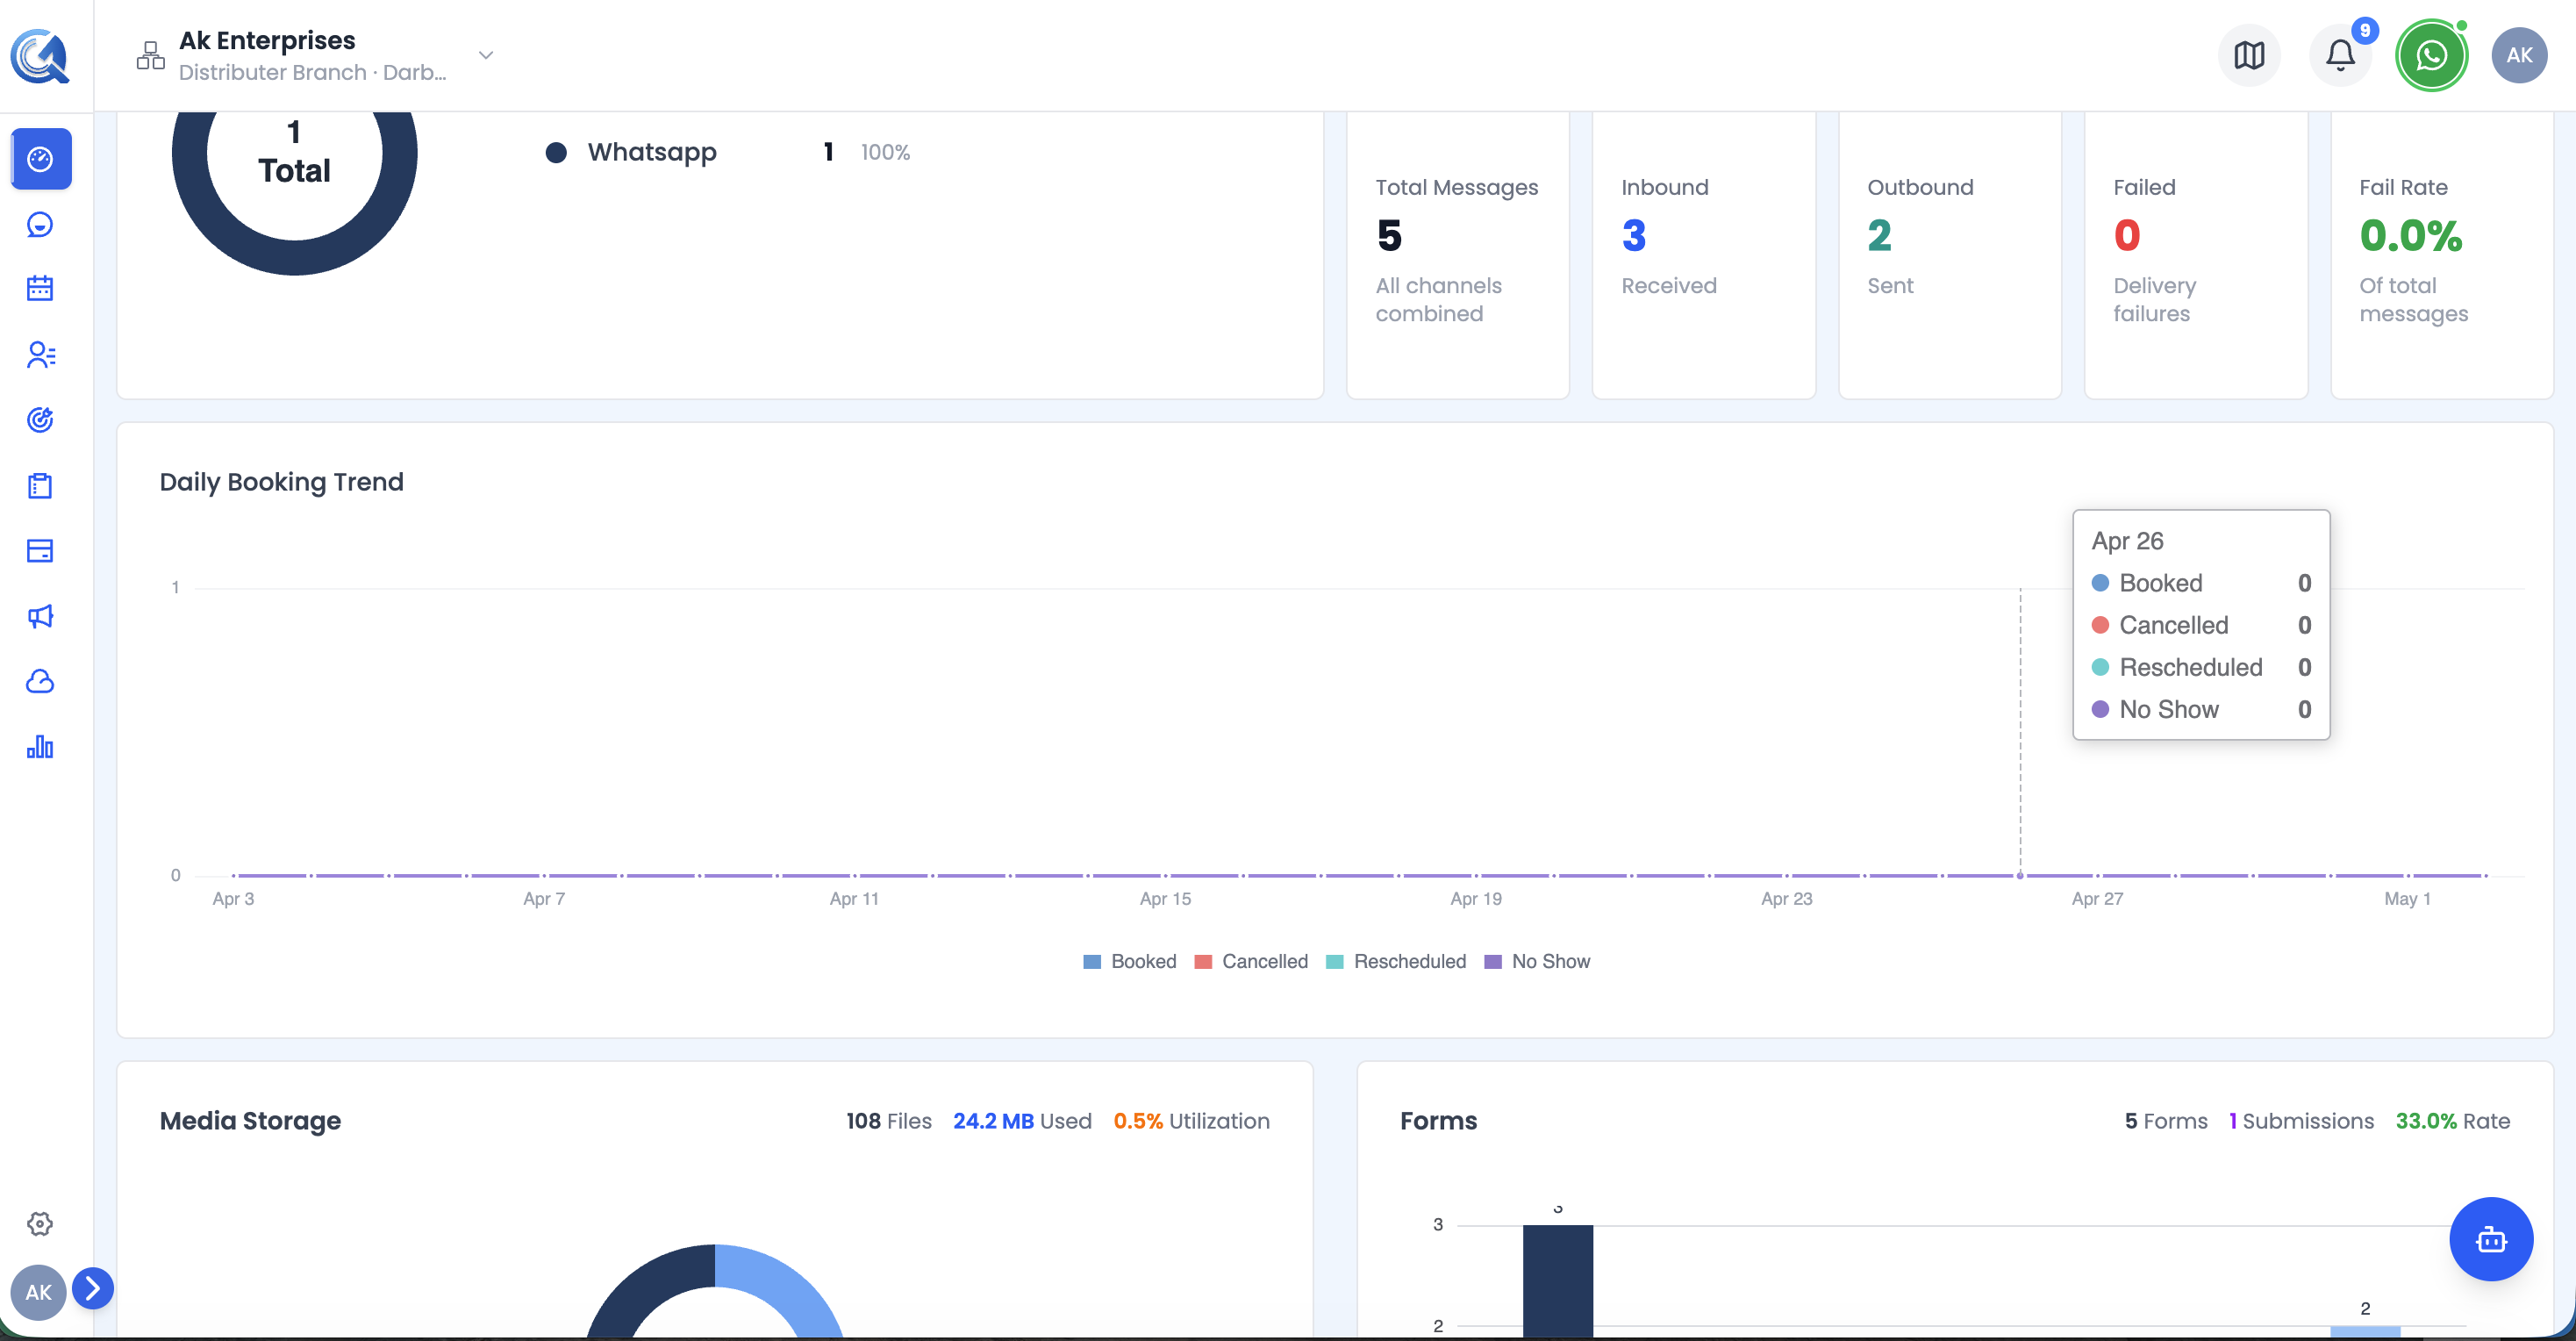 Each bar represents one day. Taller bars indicate higher booking activity. Hover over a bar to see the exact count.
Use this chart to:
- Spot busy and slow booking periods
- Identify patterns (e.g., peak days of the week)
- Correlate appointment volume with campaigns or promotions run during the period
Note: This chart reflects all calendars in your workspace. To drill into individual calendar or team performance, visit the full Calendar section.