Conversations Section
The Conversations row surfaces messaging health metrics — channel distribution, conversation volume KPIs, and message delivery statistics. Two sub-sections are stacked: the channel chart on the left, and KPI + message stat cards on the right.
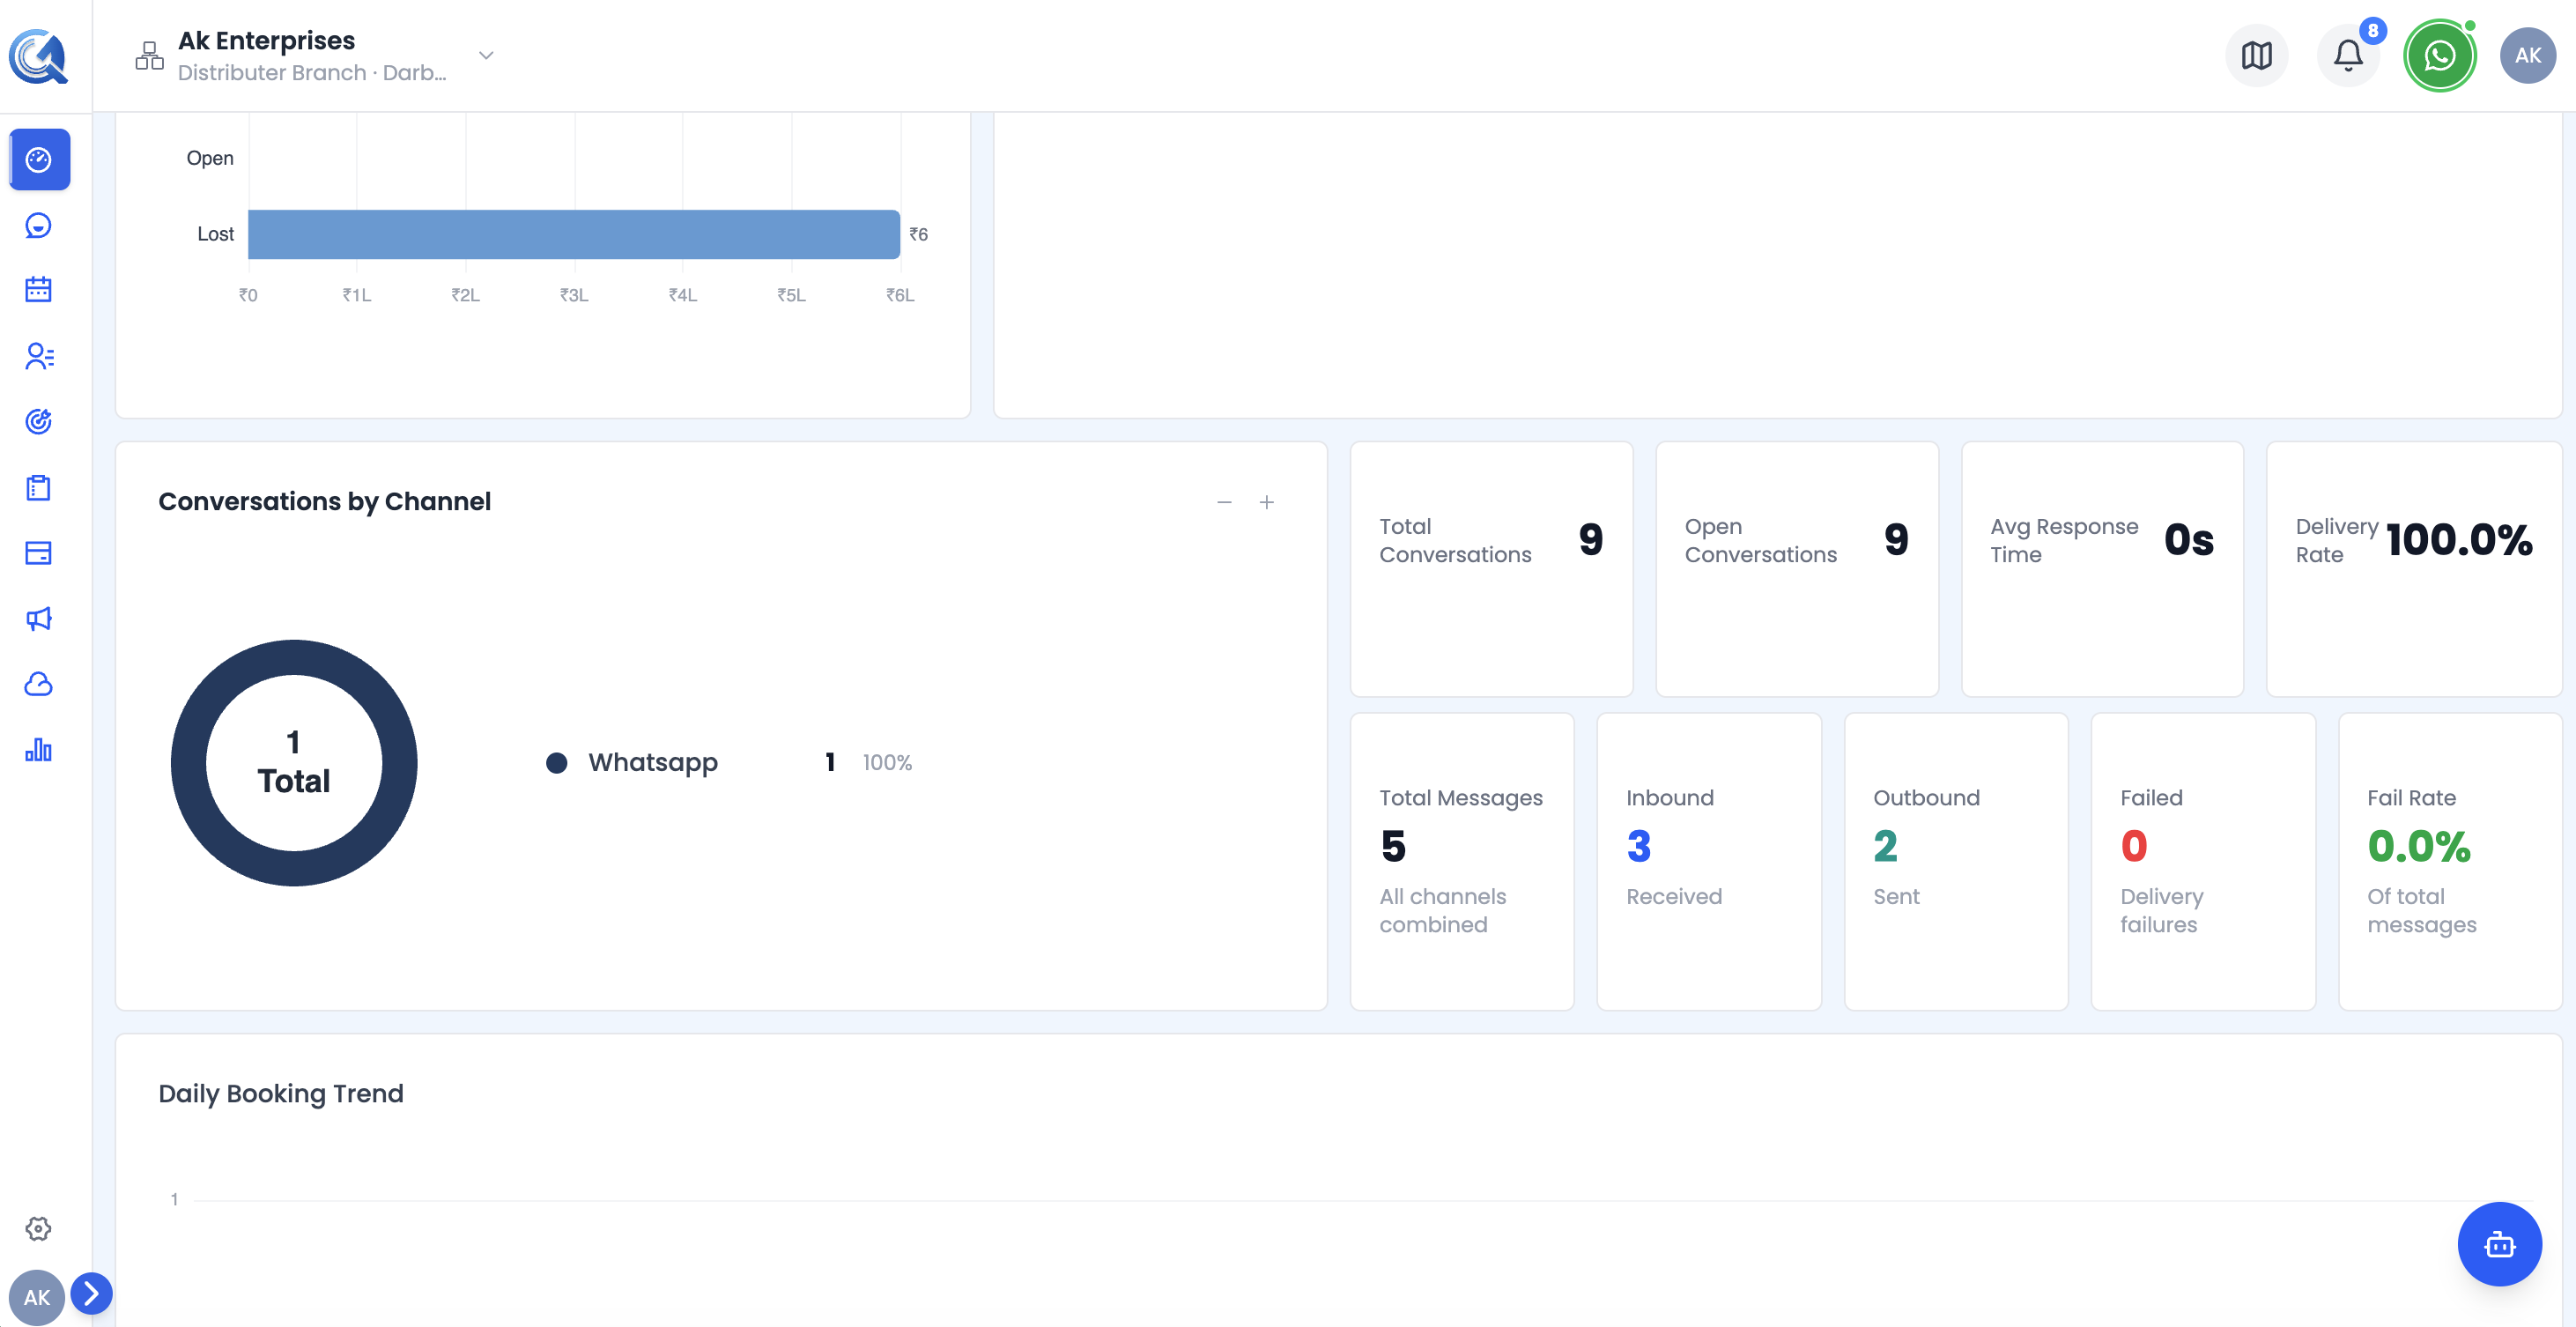 The Conversations row showing the channel distribution chart, KPI cards, and message delivery stats.
Conversations by Channel Chart
A donut pie chart showing how your conversations are distributed across communication channels (WhatsApp, Email, SMS, Chat, and others).
The right side of the widget shows a legend with:
- Channel name
- Absolute count
- Percentage share
Use the +/− resize buttons to expand or collapse the chart height (options: 140 px, 200 px, 280 px, 380 px).
Conversations KPI Cards
Four horizontal cards showing core conversation health metrics:
| Card | What it measures |
|---|---|
| Total Conversations | All conversations opened in the period |
| Open Conversations | Conversations still unresolved |
| Avg Response Time | Average time to first reply (shown as Xm Ys) |
| Delivery Rate | Percentage of messages successfully delivered |
Message KPI Cards
Five cards showing message-level delivery statistics:
| Card | What it measures |
|---|---|
| Total Messages | All messages sent and received |
| Inbound | Messages received from contacts |
| Outbound | Messages sent to contacts |
| Failed | Messages that failed to deliver |
| Fail Rate | Failure percentage, colour-coded: green (<10%), yellow (10–30%), red (>30%) |