Media & Forms Section
The bottom row of the Dashboard shows two side-by-side widgets: a Media Storage breakdown and a Forms activity summary. Both respond to the global date range picker.
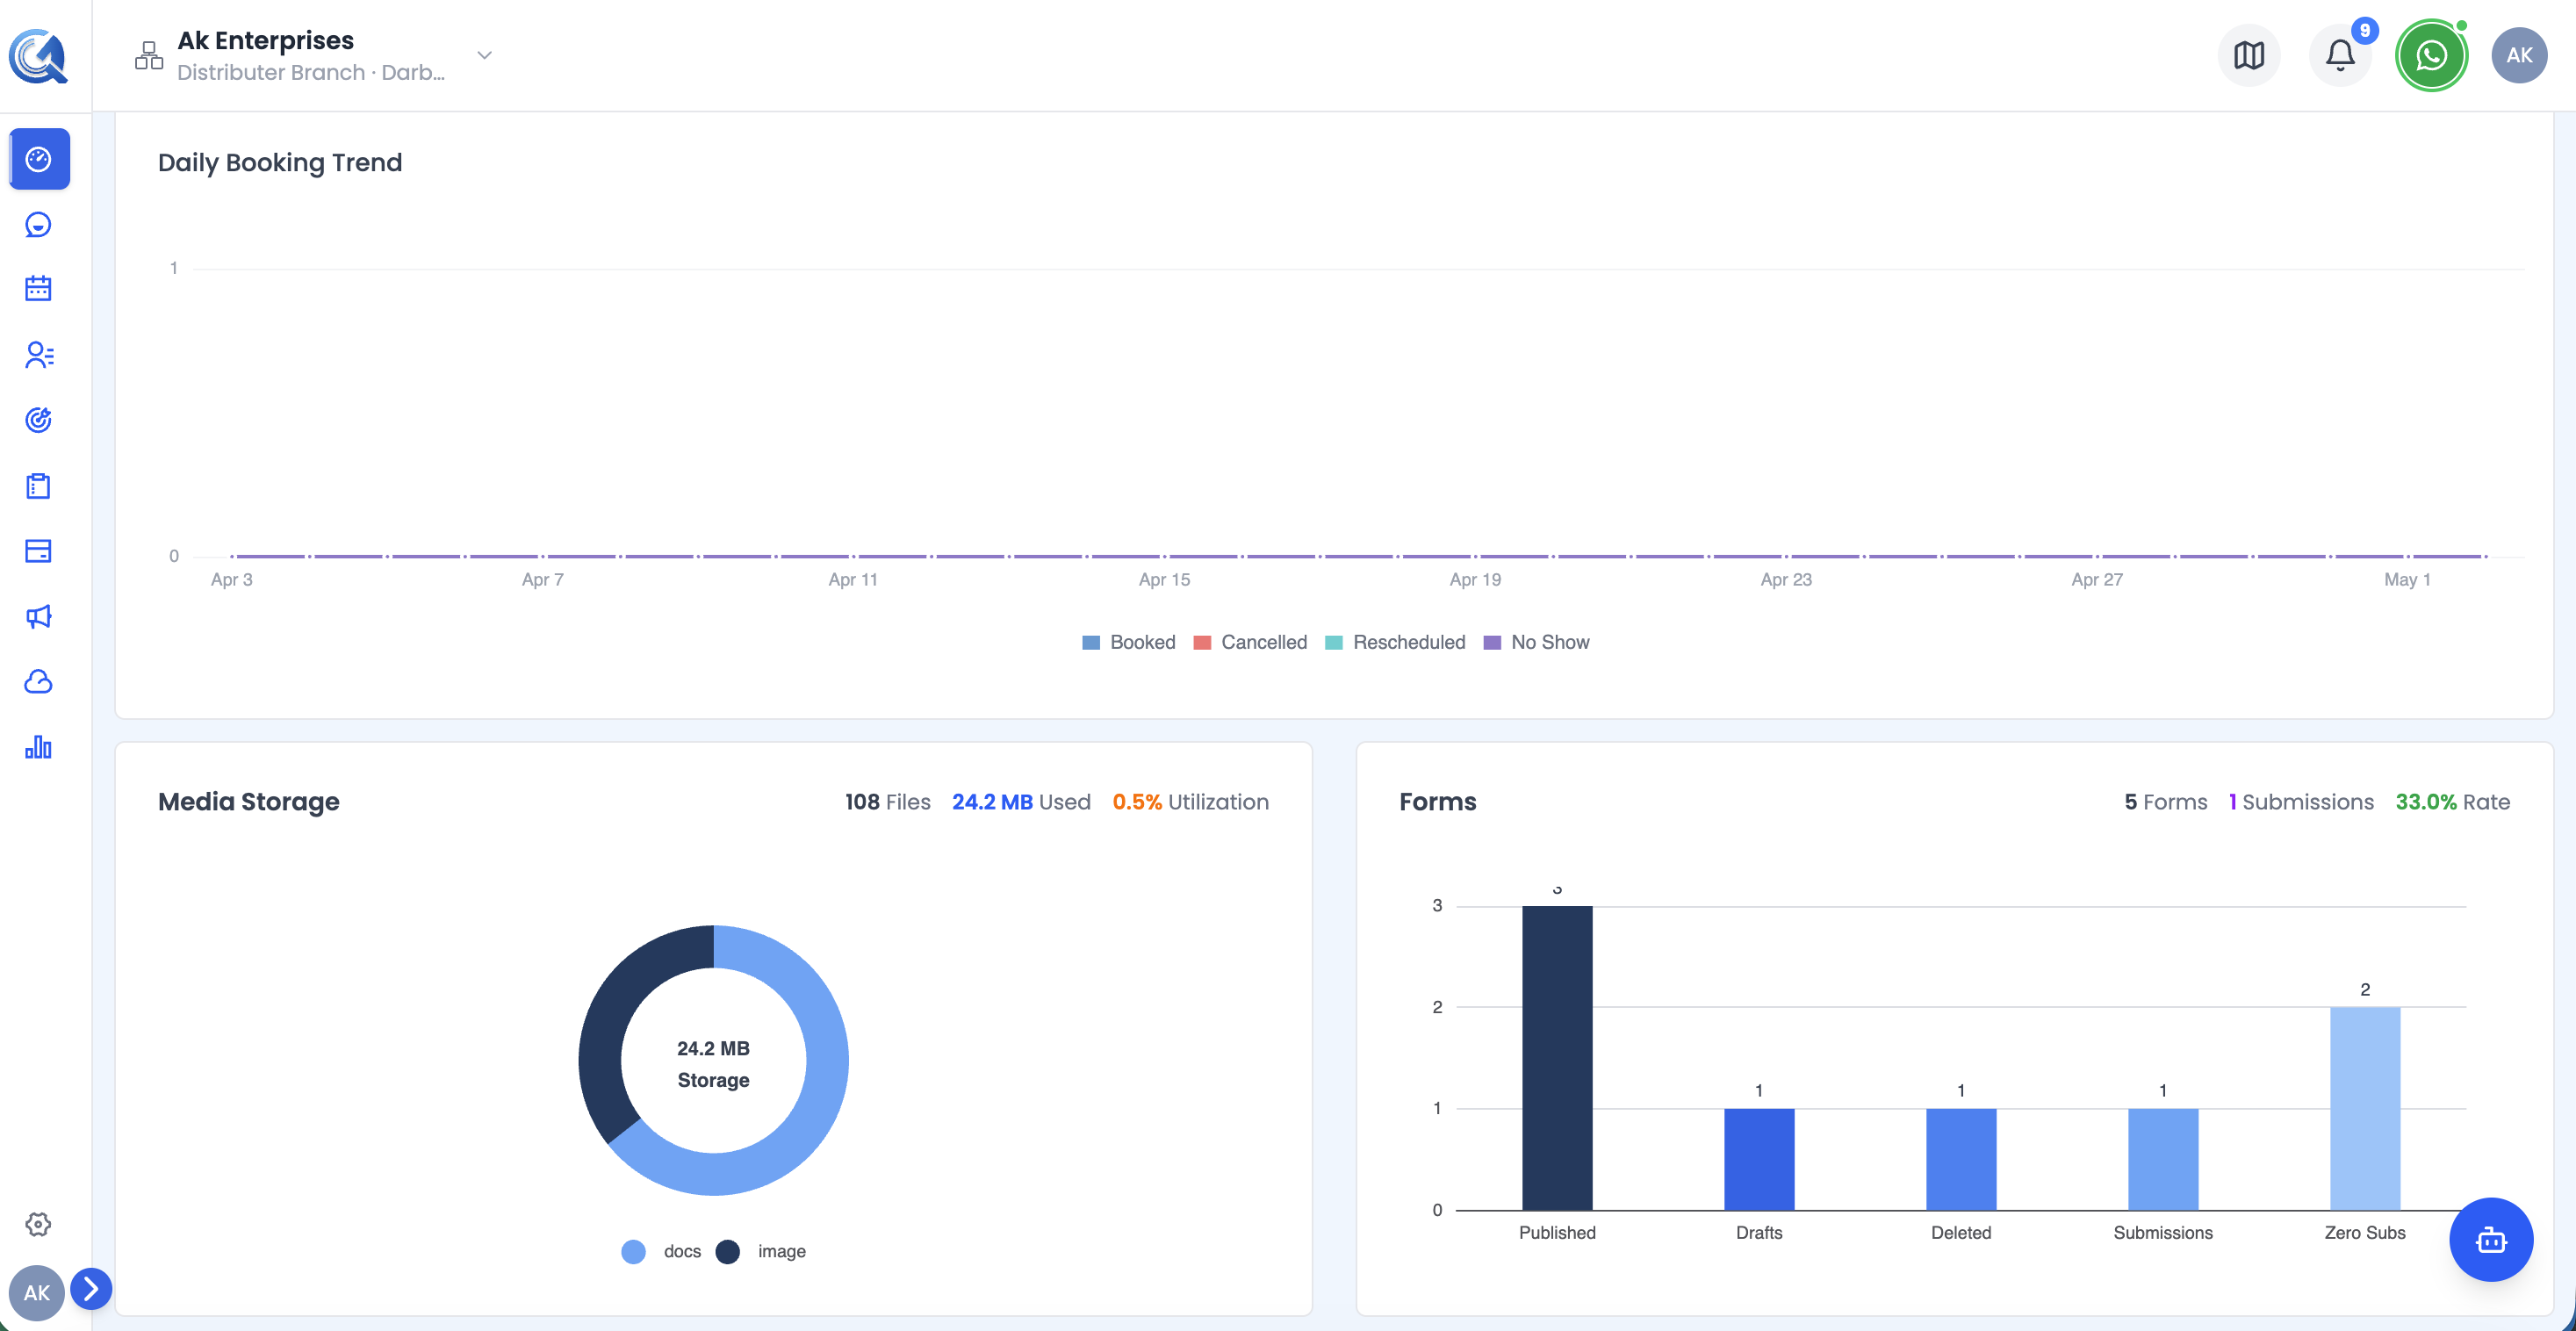 The Media & Forms row showing storage usage by file type and form activity side by side.
Media Storage Overview
A donut chart showing how your storage quota is consumed, broken down by file type:
| Segment | File type |
|---|---|
| Images | JPG, PNG, GIF, SVG, WebP |
| Video | MP4 and other video formats |
| Audio | MP3 and other audio formats |
| Documents | PDF, Word, Excel, CSV, TXT |
| Other | All remaining file types |
The centre of the donut shows total storage used (formatted automatically as B, KB, MB, GB, or TB).
The header above the chart shows three quick stats:
| Stat | What it shows |
|---|---|
| Files | Total number of files stored |
| Used Storage | Total space consumed |
| Utilization % | Used storage as a percentage of your plan's total quota |
Tip: For a detailed per-file breakdown and recent upload history, visit the full Media Storage section via the main navigation.
Forms Overview
A vertical bar chart showing form activity metrics:
| Bar | What it counts |
|---|---|
| Published | Forms currently live and accepting responses |
| Drafts | Forms saved but not yet published |
| Deleted | Forms moved to trash |
| Total Submissions | All form responses received |
| Zero Submissions | Published forms with no responses yet |
Bars are colour-coded from dark to light blue. Value labels appear on top of each bar.
The header shows three summary stats: Total Forms, Submissions, and Submission Rate (submissions ÷ published forms).