Opportunities Section
The Opportunities row shows three widgets side by side, giving you a complete view of your deal pipeline — status distribution, monetary value, and stage-by-stage funnel progression.
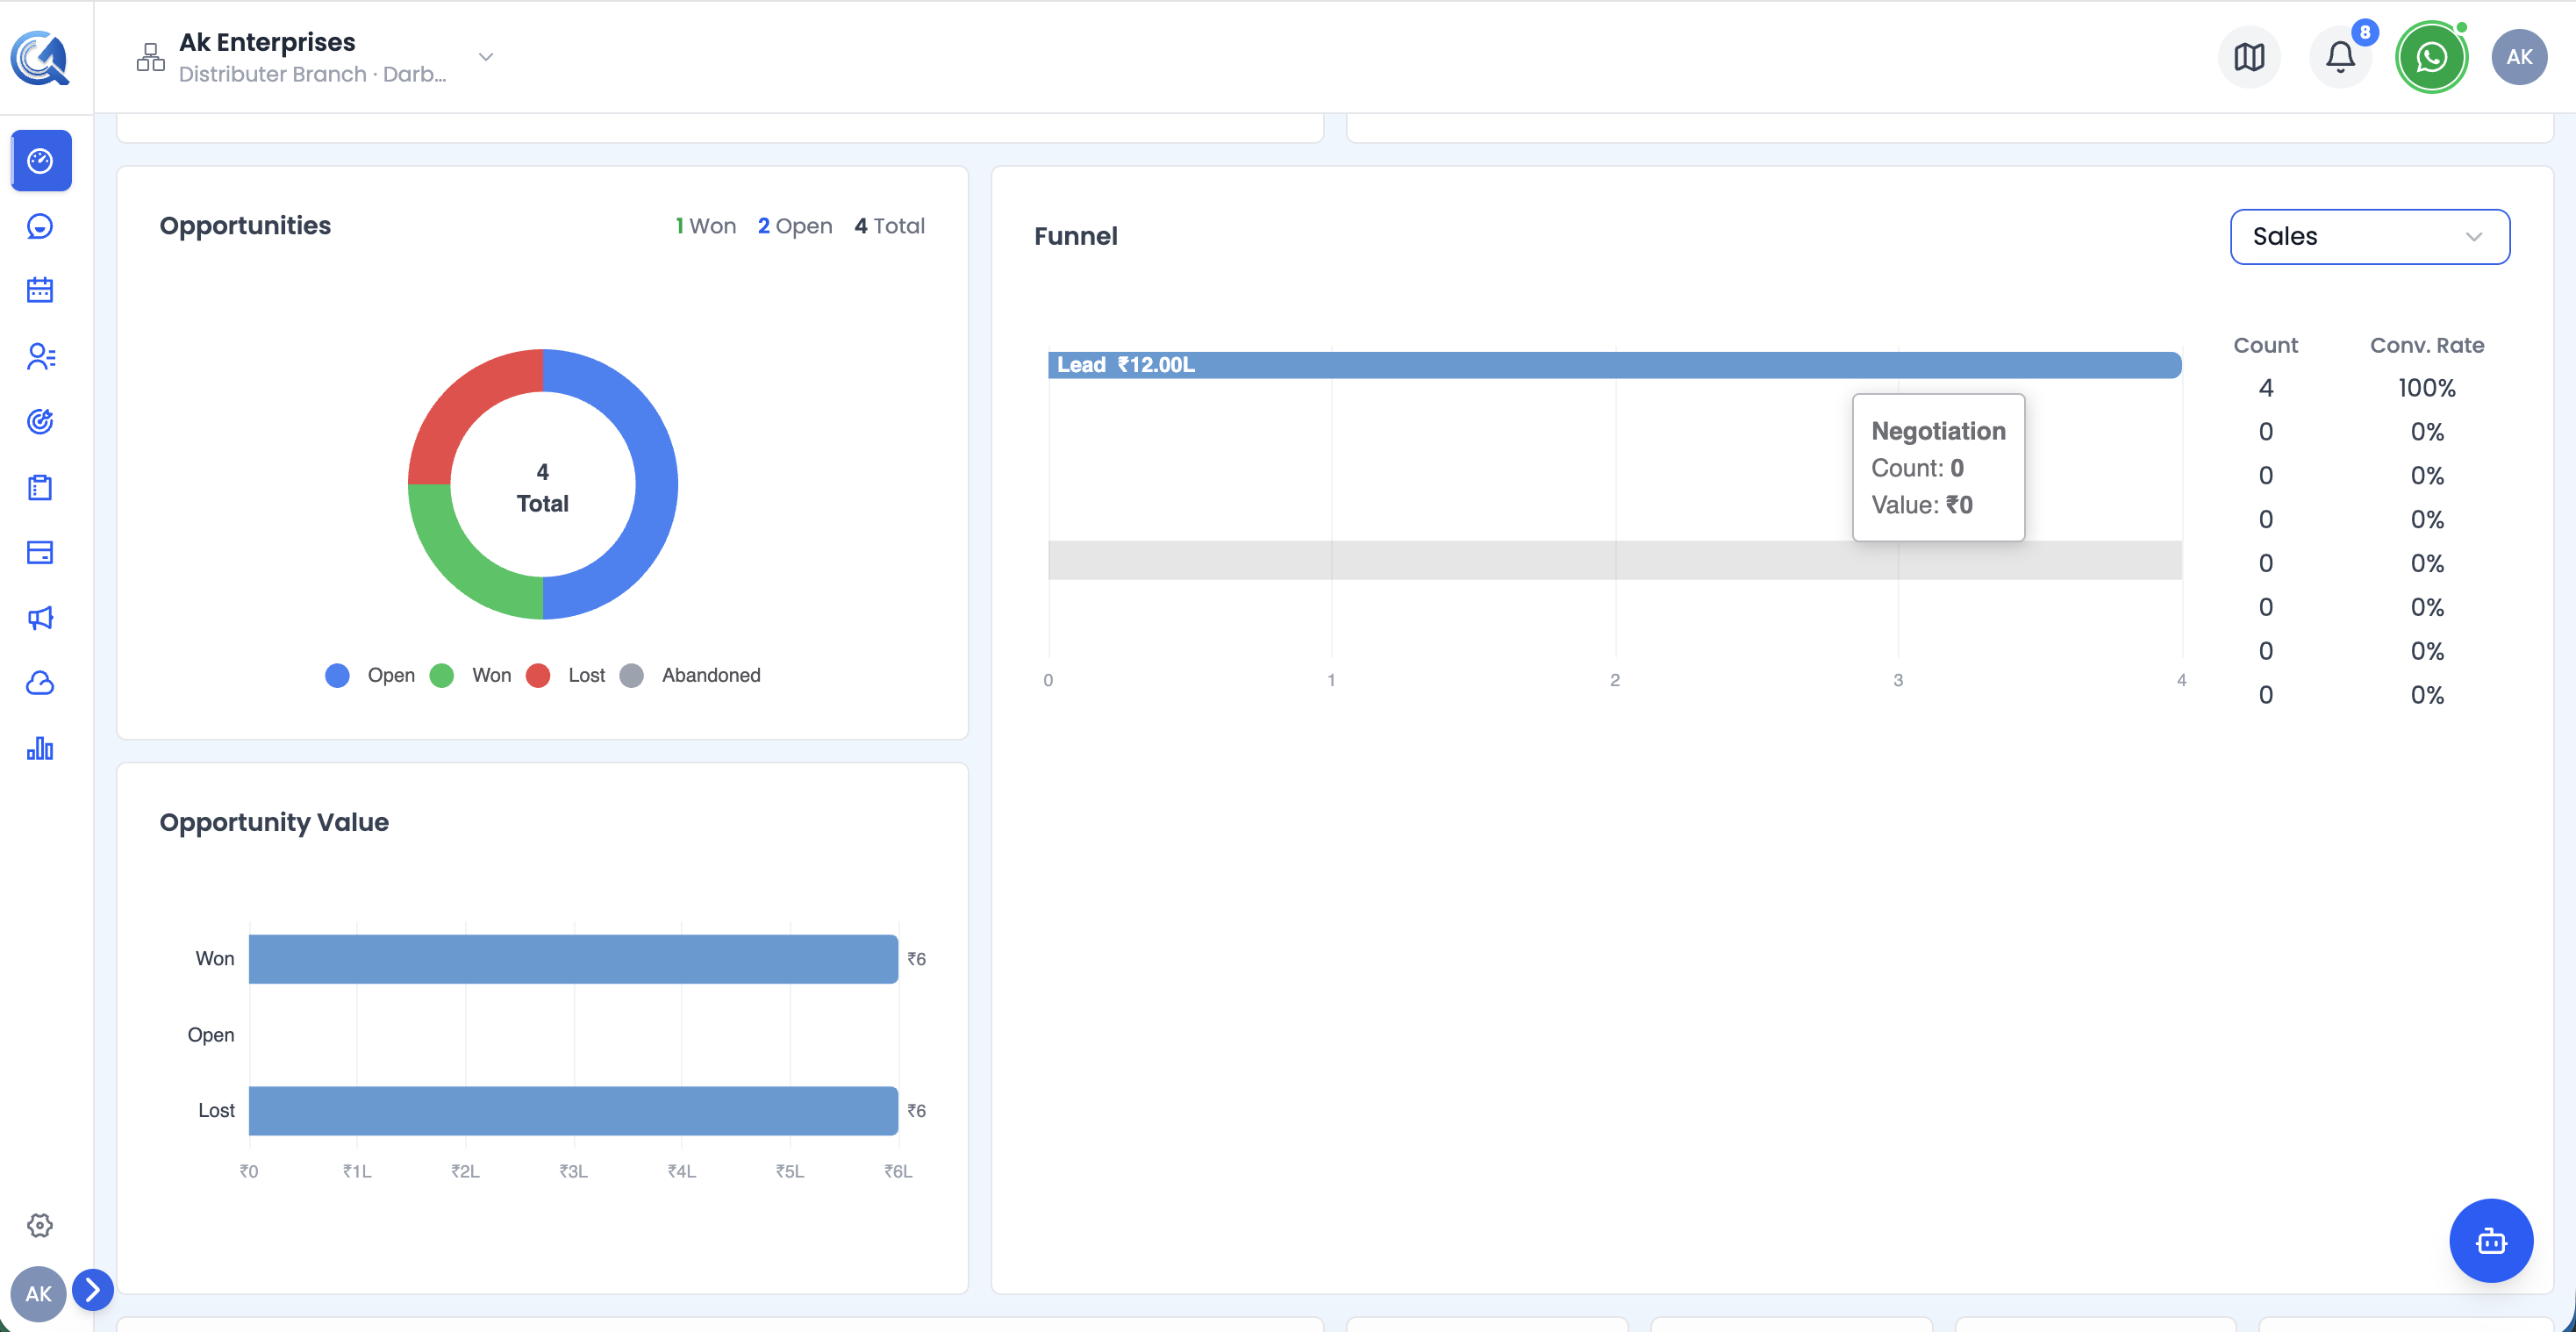 The Opportunities row showing the status donut, value chart, and pipeline funnel side by side.
Opportunities Status Donut
A donut chart showing how opportunities are distributed by outcome status:
| Segment | Colour | What it means |
|---|---|---|
| Open | Blue | Deals still active |
| Won | Green | Deals closed successfully |
| Lost | Red | Deals lost to competition or rejection |
| Abandoned | Gray | Deals dropped without a decision |
The centre of the donut shows the total opportunity count.
The header above the chart shows quick-read stats: Won, Open, and Total.
Opportunity Value Chart
A horizontal bar chart (stacked below the donut) showing the monetary value of opportunities grouped by status:
| Bar | What it shows |
|---|---|
| Won Value | Total ₹ value of won deals |
| Open Value | Total ₹ value of open deals |
| Lost Value | Total ₹ value of lost deals |
Values are formatted in Indian currency notation (₹1L, ₹10L, etc.). The total pipeline value is shown in the header.
Pipeline Funnel Chart
The full-height right widget is a horizontal funnel showing how opportunities progress through your pipeline stages. Use the pipeline selector dropdown to switch between different pipelines.
For each stage the chart shows:
- Stage name
- Count — number of opportunities in that stage
- Value — total ₹ value at that stage
- Conversion rate — percentage that moved from the previous stage
Tip: Use the pipeline dropdown at the top of the chart to switch between pipelines if you have more than one configured.