AI Agents Report
The AI Agents report shows how your AI agents are performing — conversation volume, lead capture, and where to focus tuning effort.
This report always shows all-time data. There is no date range picker, no other filters, and no CSV export.
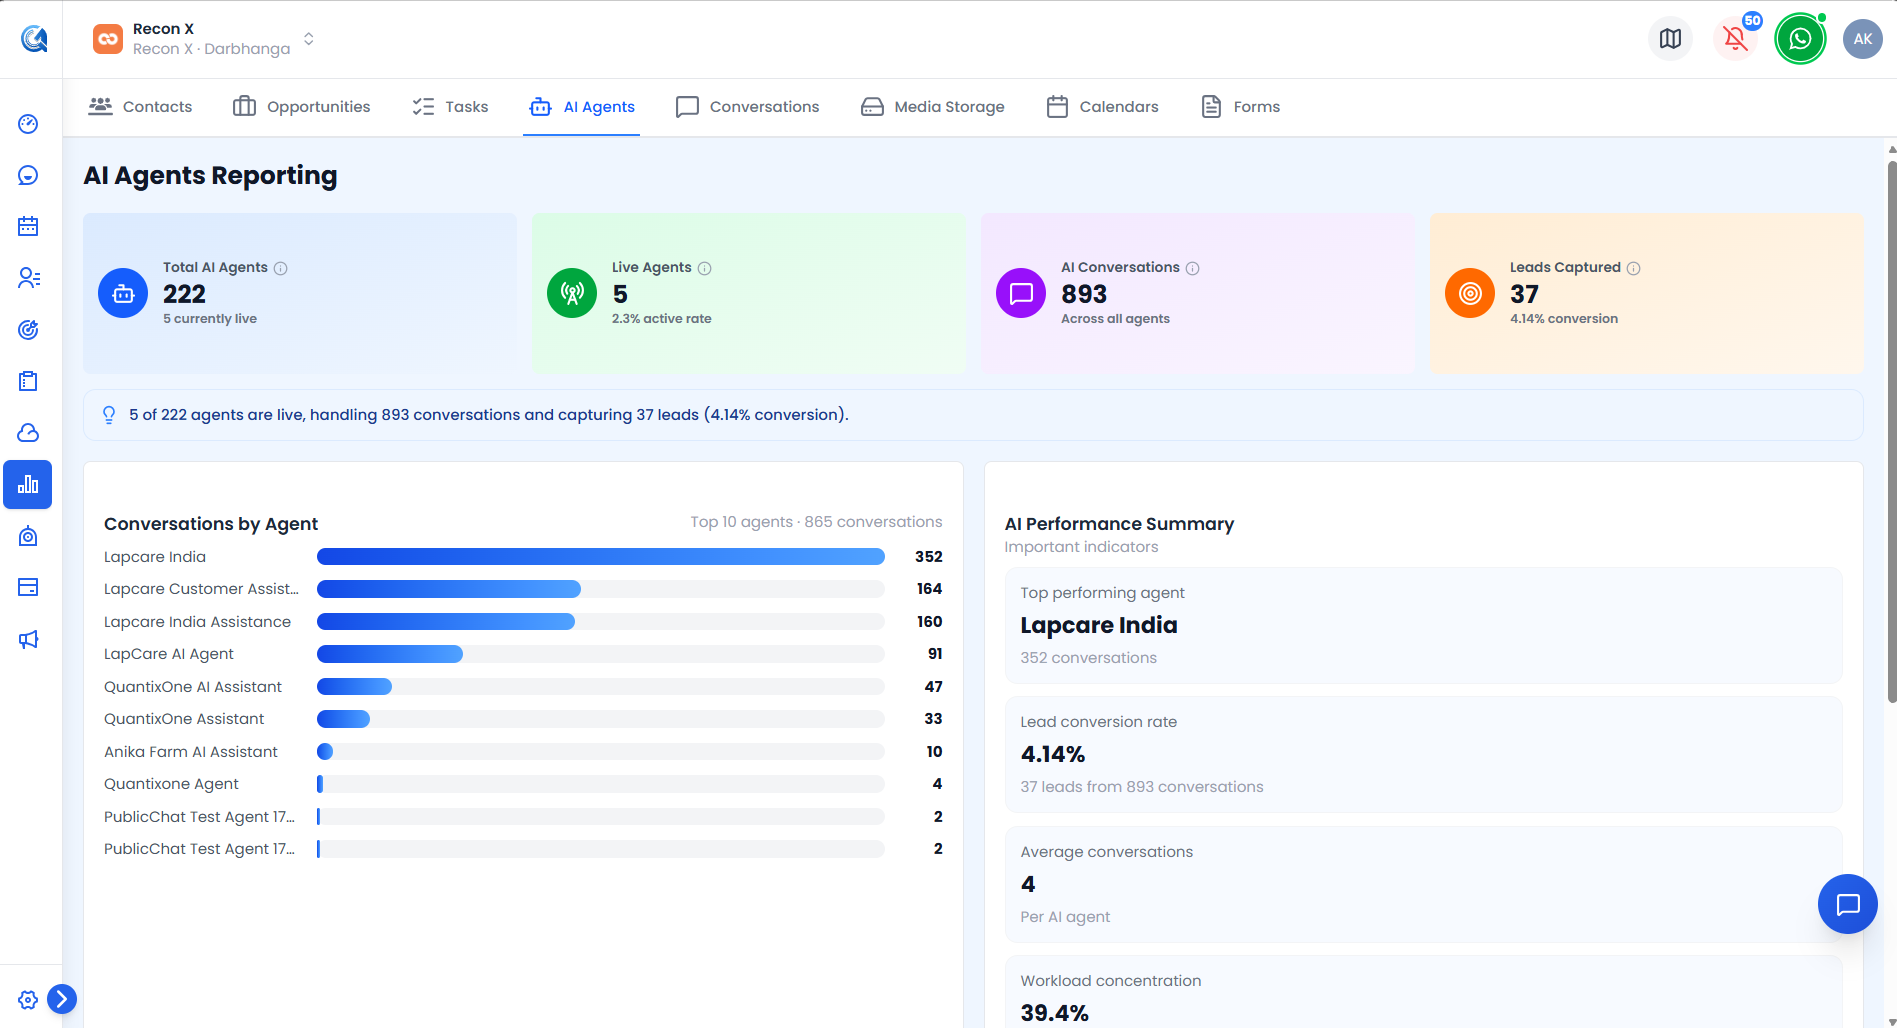 Top of the AI Agents report — KPI cards and the Conversations by Agent chart.
AI Agents KPI Cards
 The AI Agents KPI cards and the insight banner below them.
| Card | What it shows |
|---|---|
| Total AI Agents | All configured AI agents, with a note on how many are currently live |
| Live Agents | Agents currently active, plus live rate (%) |
| AI Conversations | Total conversations handled by AI agents |
| Leads Captured | Leads captured by AI agents, plus conversion rate (%) |
An insight banner below the cards highlights a notable trend when one is available.
Conversations by Agent Chart
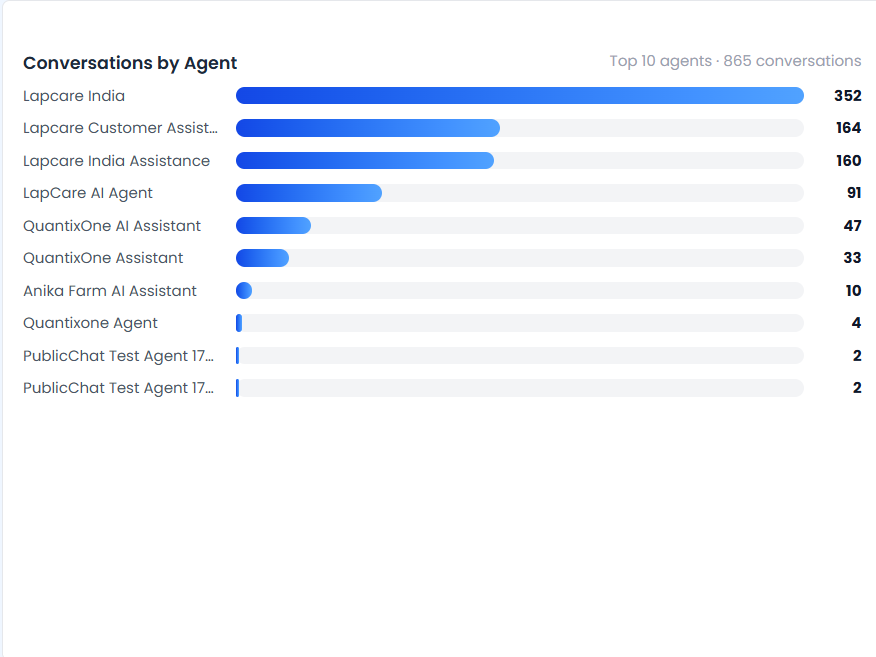 The Conversations by Agent chart.
A horizontal progress-bar breakdown of conversation volume per agent, with a header showing how many agents are shown and the total conversation count.
Use this to see which agents are handling the most conversations.
Performance Summary
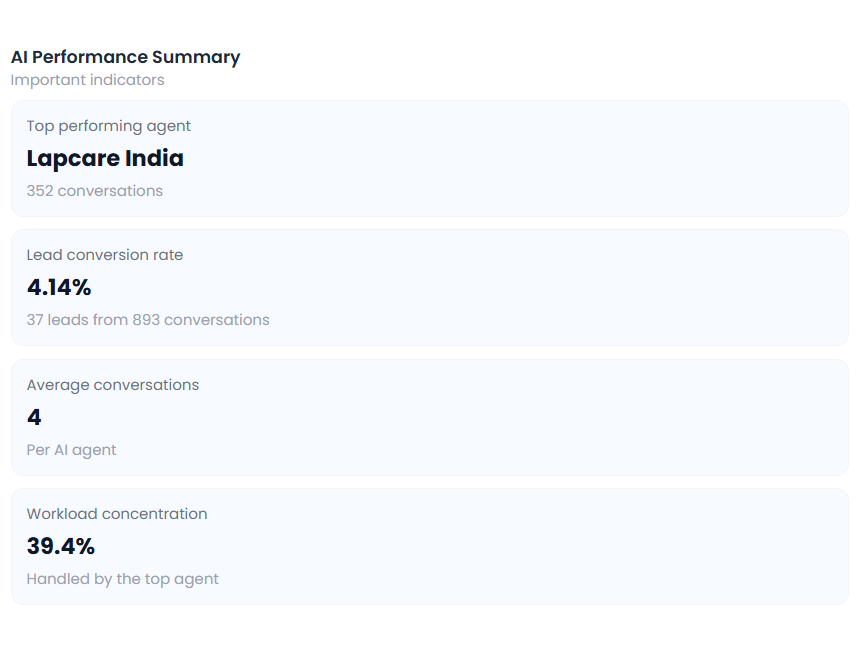 The Performance Summary's four stat tiles.
Four stat tiles: top performing agent (name and conversation count), lead conversion rate, average conversations per agent, and workload concentration — the percentage of conversations handled by the top agent.
Use this to spot over-reliance on a single agent or gauge overall AI performance at a glance.
AI Agent Insights
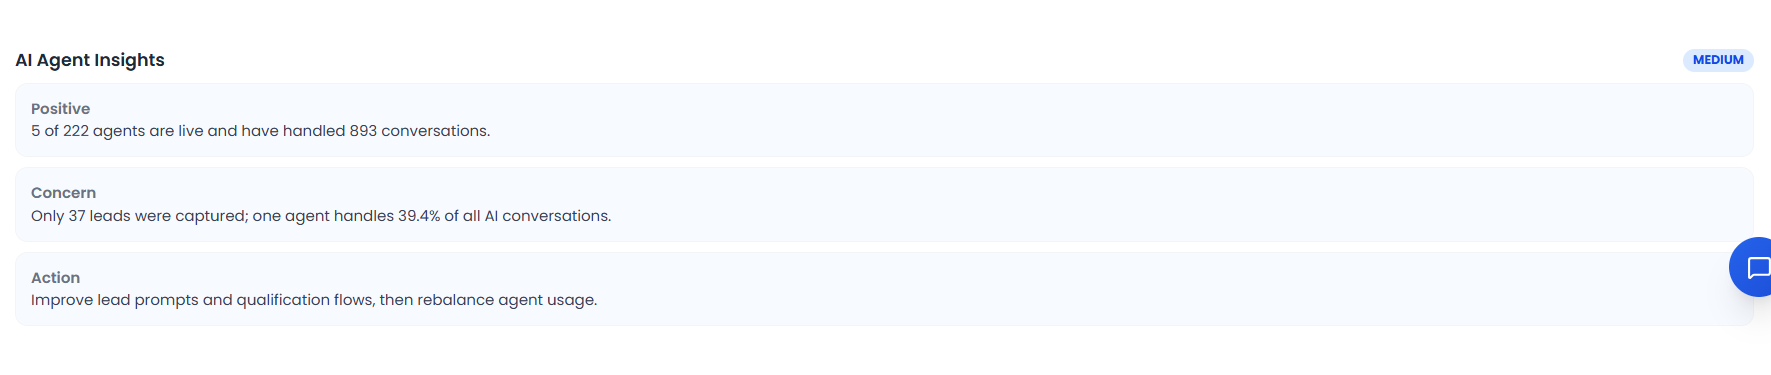 The AI Agent Insights card with its severity badge.
A card highlighting one positive, one concern, and one recommended action, tagged with a severity level (Low, Medium, High, or Critical).
Use this as a quick, prioritized read on what needs attention across your AI agents.
Video Walkthrough
Watch the complete walkthrough below.