Contacts Report
The Contacts report shows you how your contact base is growing, where contacts are coming from, and how your team is performing on tasks.
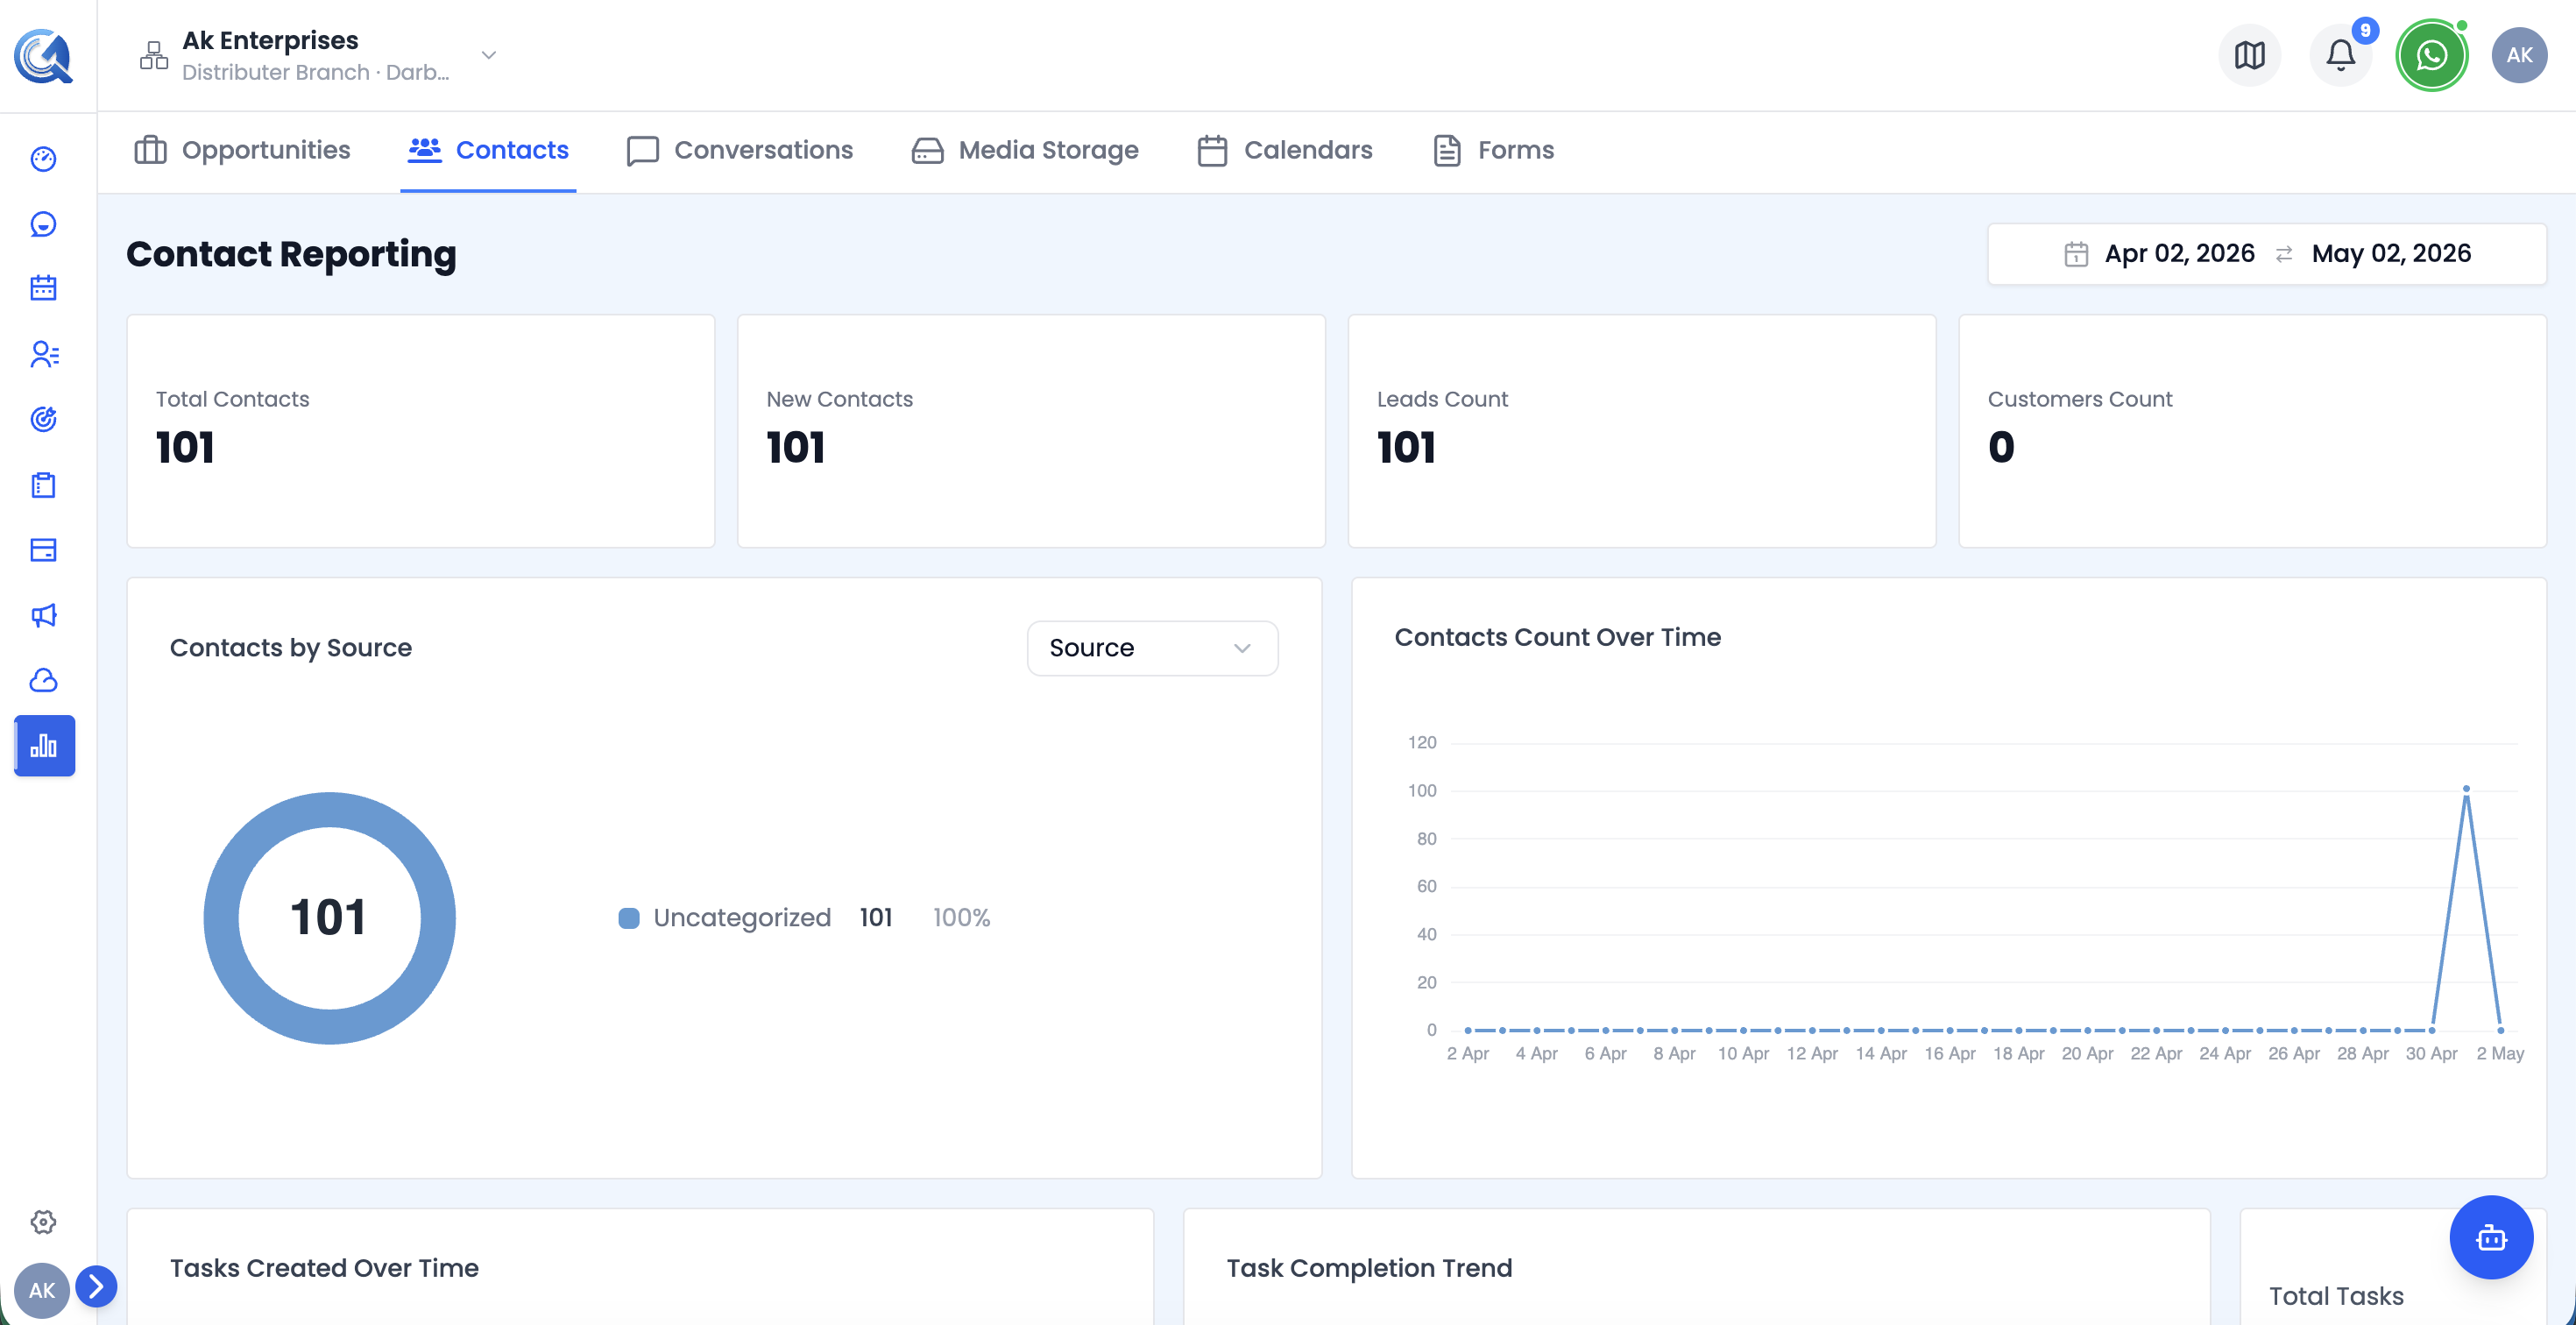 Top of the Contacts report — KPI cards and the breakdown chart.
Contacts KPI Cards
Four headline metrics at the top:
| Card | What it shows |
|---|---|
| Total Contacts | All contacts in the selected period |
| New Contacts | Contacts added during the period |
| Leads | Contacts tagged as leads |
| Customers | Contacts tagged as customers |
Contacts Breakdown Chart
A donut chart showing how contacts are distributed across a selected dimension. Use the Group By dropdown to switch between Source, Owner, Tags, Type, Country, City, State, Assigned To, or Company. The chart shows the top 10 values and displays the total count in the centre.
Use this chart to identify which acquisition sources or team members are bringing in the most contacts.
Tasks Leaderboard
A data table ranking team members by task performance — the most actionable view for managers:
| Column | Description |
|---|---|
| Assignee | Team member name |
| Total Assigned | Tasks assigned to them |
| Completed | Tasks they completed |
| Overdue | Tasks currently overdue |
| Completion Rate | Completed ÷ Assigned (%) |
Sortable by any column. Shows up to 50 rows per page.
Video Walkthrough
Watch the complete walkthrough below.