Conversations Report
The Conversations report covers your messaging health — volume across channels, delivery performance, and campaign results.
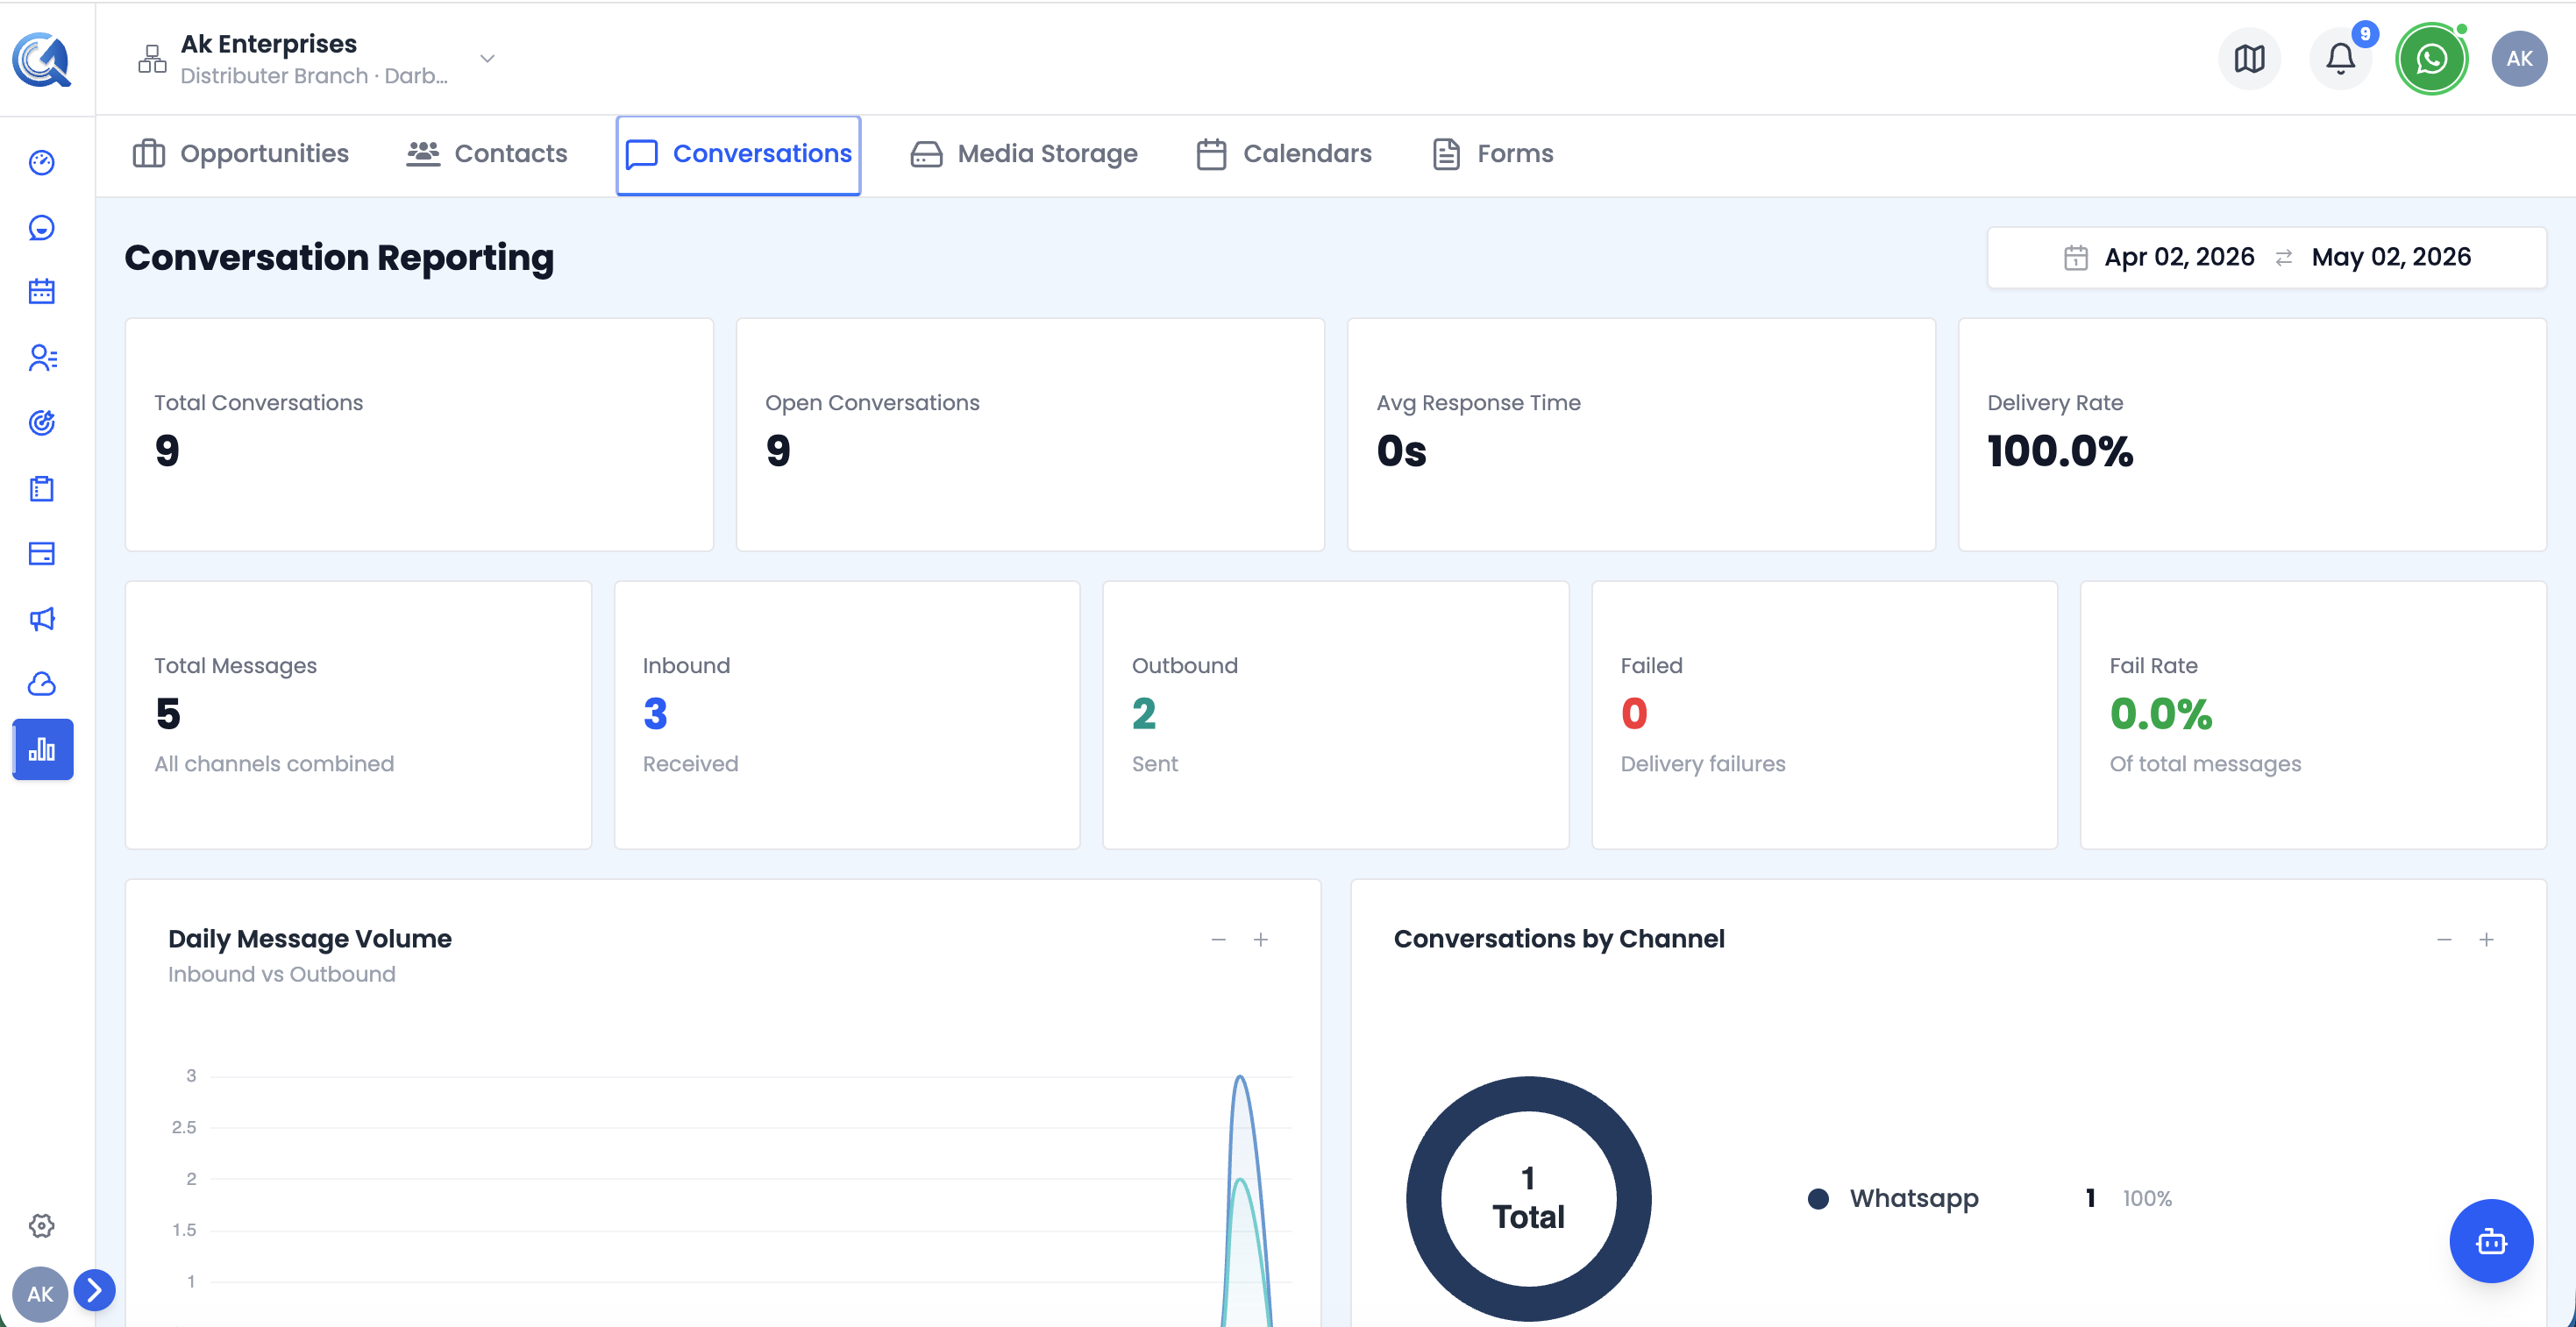 Top of the Conversations report — conversation KPIs and message stats cards.
Conversation KPI Cards
Four headline metrics:
| Card | What it shows |
|---|---|
| Total Conversations | All conversations opened in the period |
| Open Conversations | Conversations still unresolved |
| Avg Response Time | Average first-reply time (shown as Xm Ys) |
| Delivery Rate | % of messages successfully delivered |
Message Stats Cards
Five message-level delivery metrics:
| Card | What it shows |
|---|---|
| Total Messages | All messages sent and received |
| Inbound | Messages received from contacts |
| Outbound | Messages sent to contacts |
| Failed | Messages that failed to deliver |
| Fail Rate | Failure % — green (<10%), yellow (10–30%), red (>30%) |
Conversations by Channel Chart
A donut chart showing message distribution across channels — WhatsApp, Email, SMS, App, and others. The right-side legend shows each channel's count and percentage share.
Use this to understand which channels your contacts prefer and where your team spends most of its messaging effort.
Campaign Performance Table
Results for each messaging campaign:
| Column | Description |
|---|---|
| Campaign | Campaign name |
| Sent | Messages sent |
| Done | Successfully delivered |
| Failed | Delivery failures |
| Rate | Delivery rate — green (>90%), yellow (70–80%), red (<70%) |
Shows the 20 most recent campaigns.
Video Walkthrough
Watch the complete walkthrough below.