Forms Report
The Forms report shows how your forms are performing — submission volume over time and which forms are driving the most responses.
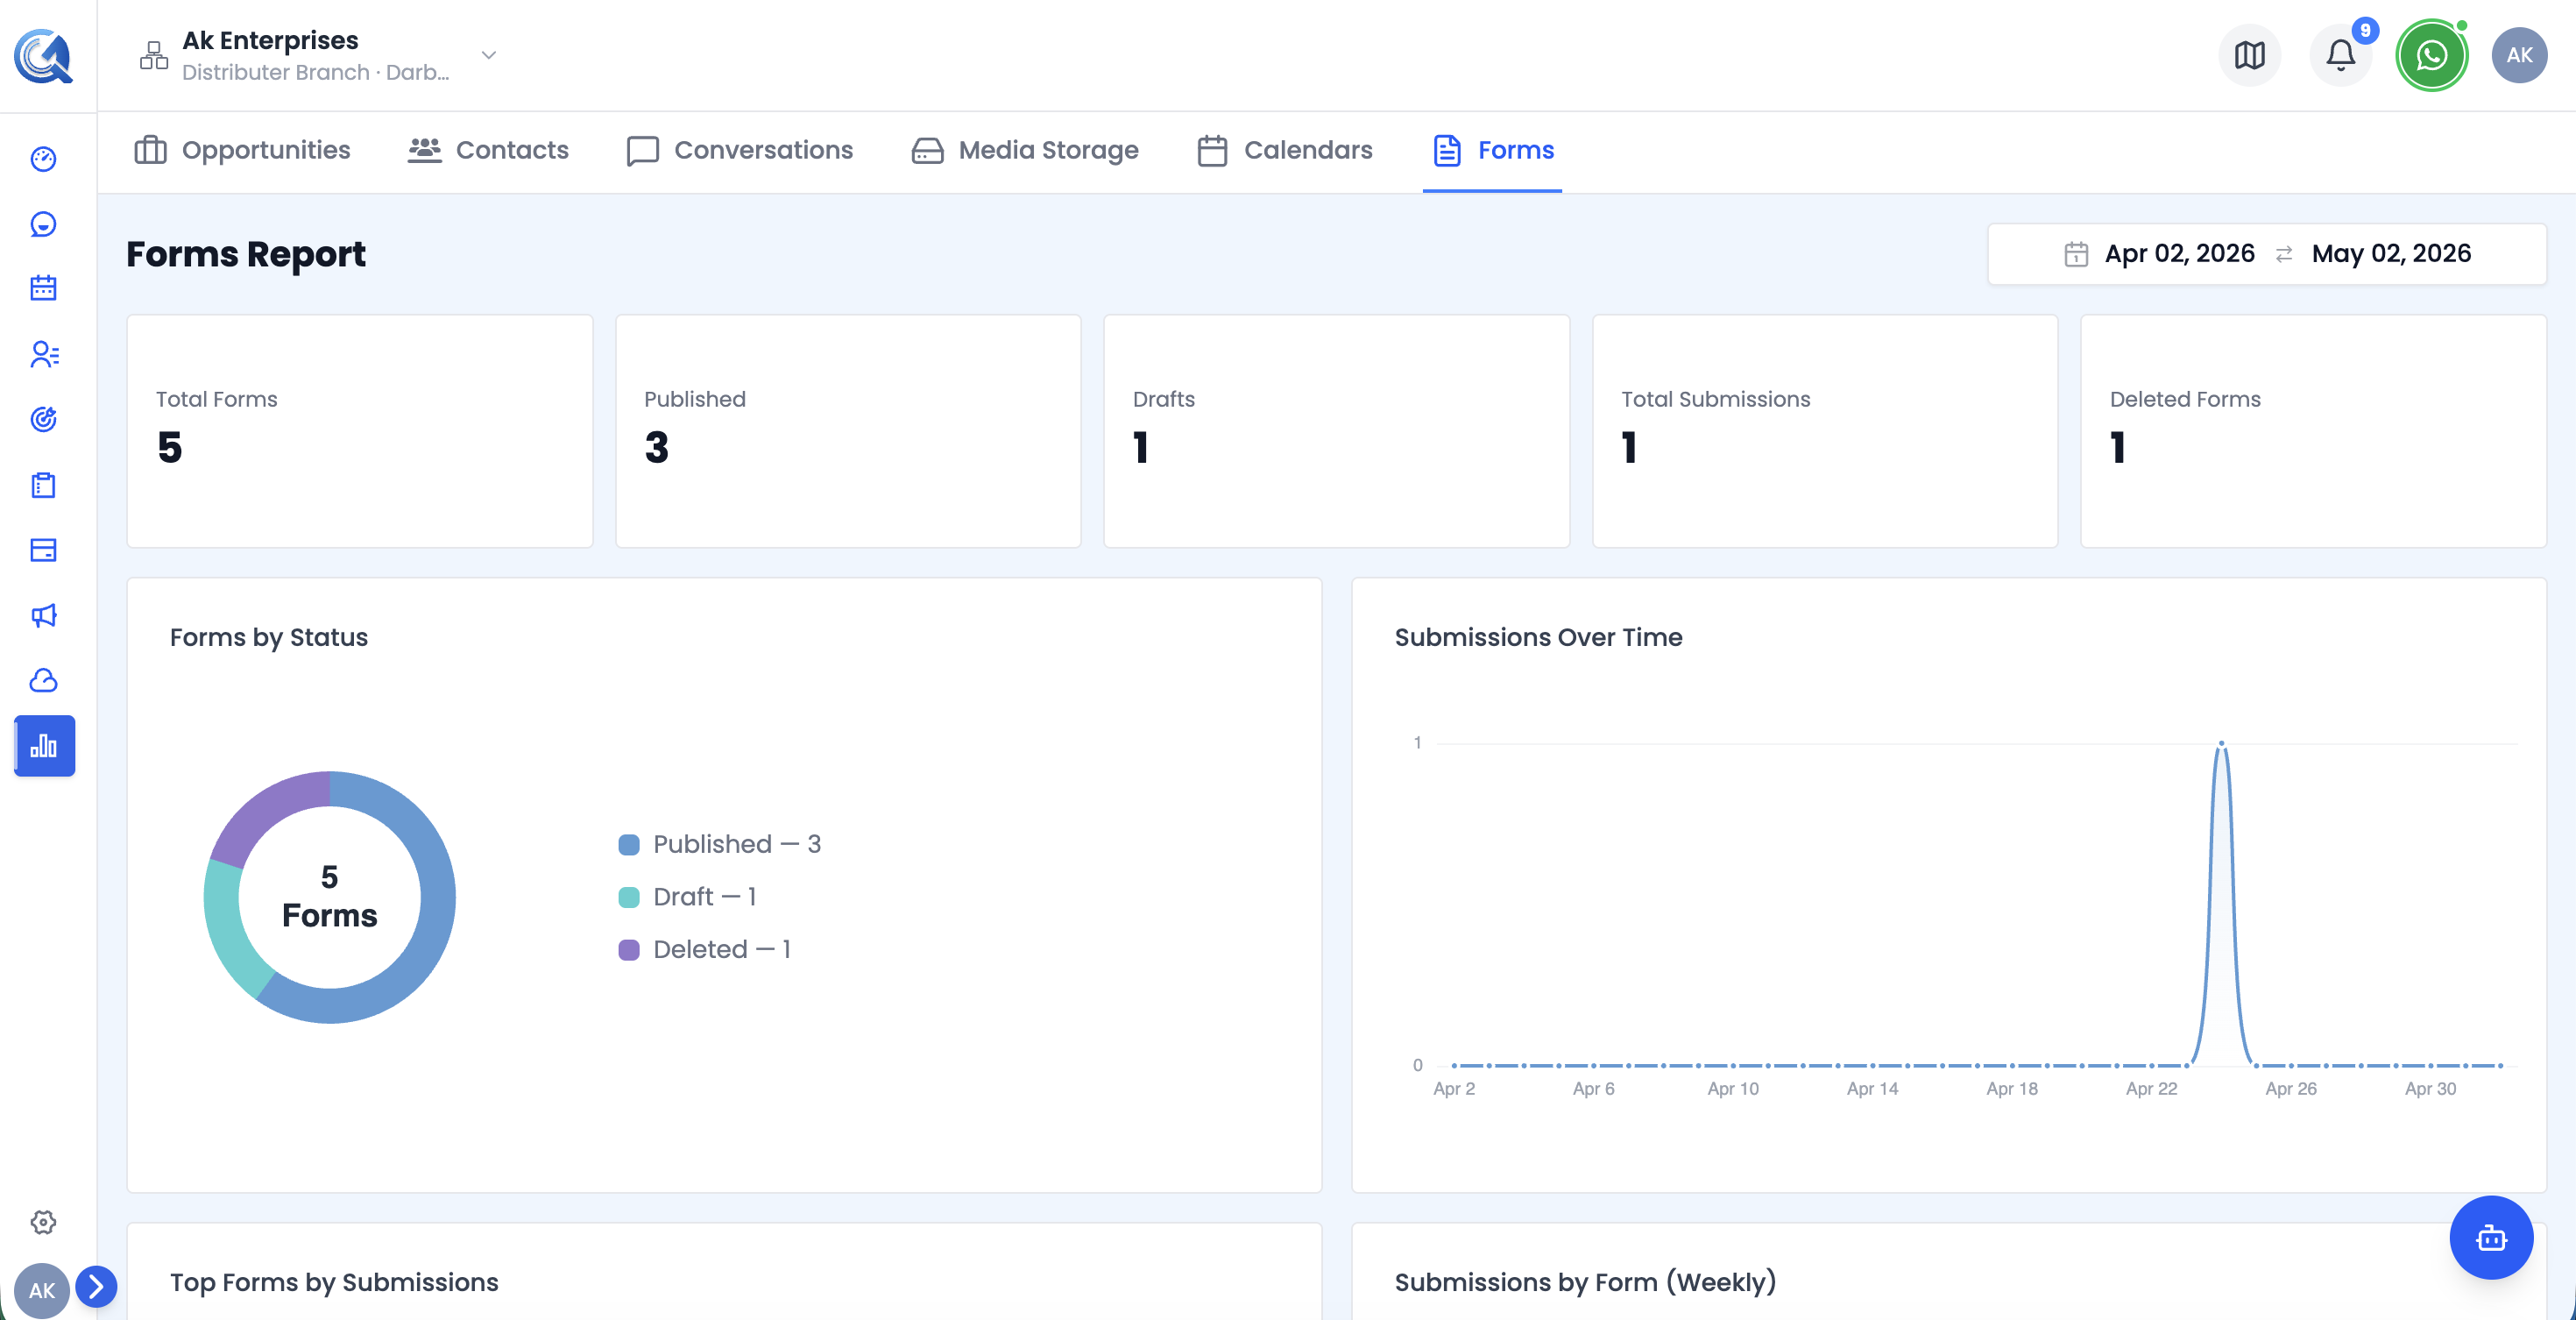 Top of the Forms report — KPI cards and the forms-by-status donut.
Forms KPI Cards
Five headline metrics:
| Card | What it shows |
|---|---|
| Total Forms | All forms in the workspace |
| Published | Forms currently live and accepting responses |
| Drafts | Forms saved but not published |
| Total Submissions | All responses received in the period |
| Deleted | Forms moved to trash |
Submissions Over Time Chart
An area line chart showing daily submission count across the selected date range. Hover over any point to see the exact count for that day.
Use this to spot submission spikes after campaigns or promotions and identify periods of low form engagement.
Top Forms by Submissions
A horizontal bar chart showing the top 5 forms ranked by submission count, sorted descending. Labels show the exact count to the right of each bar.
Use this to identify your best-performing forms and understand what makes them successful.
Video Walkthrough
Watch the complete walkthrough below.