Media Storage Report
The Media Storage report shows how your storage quota is being consumed and which file types are taking up the most space.
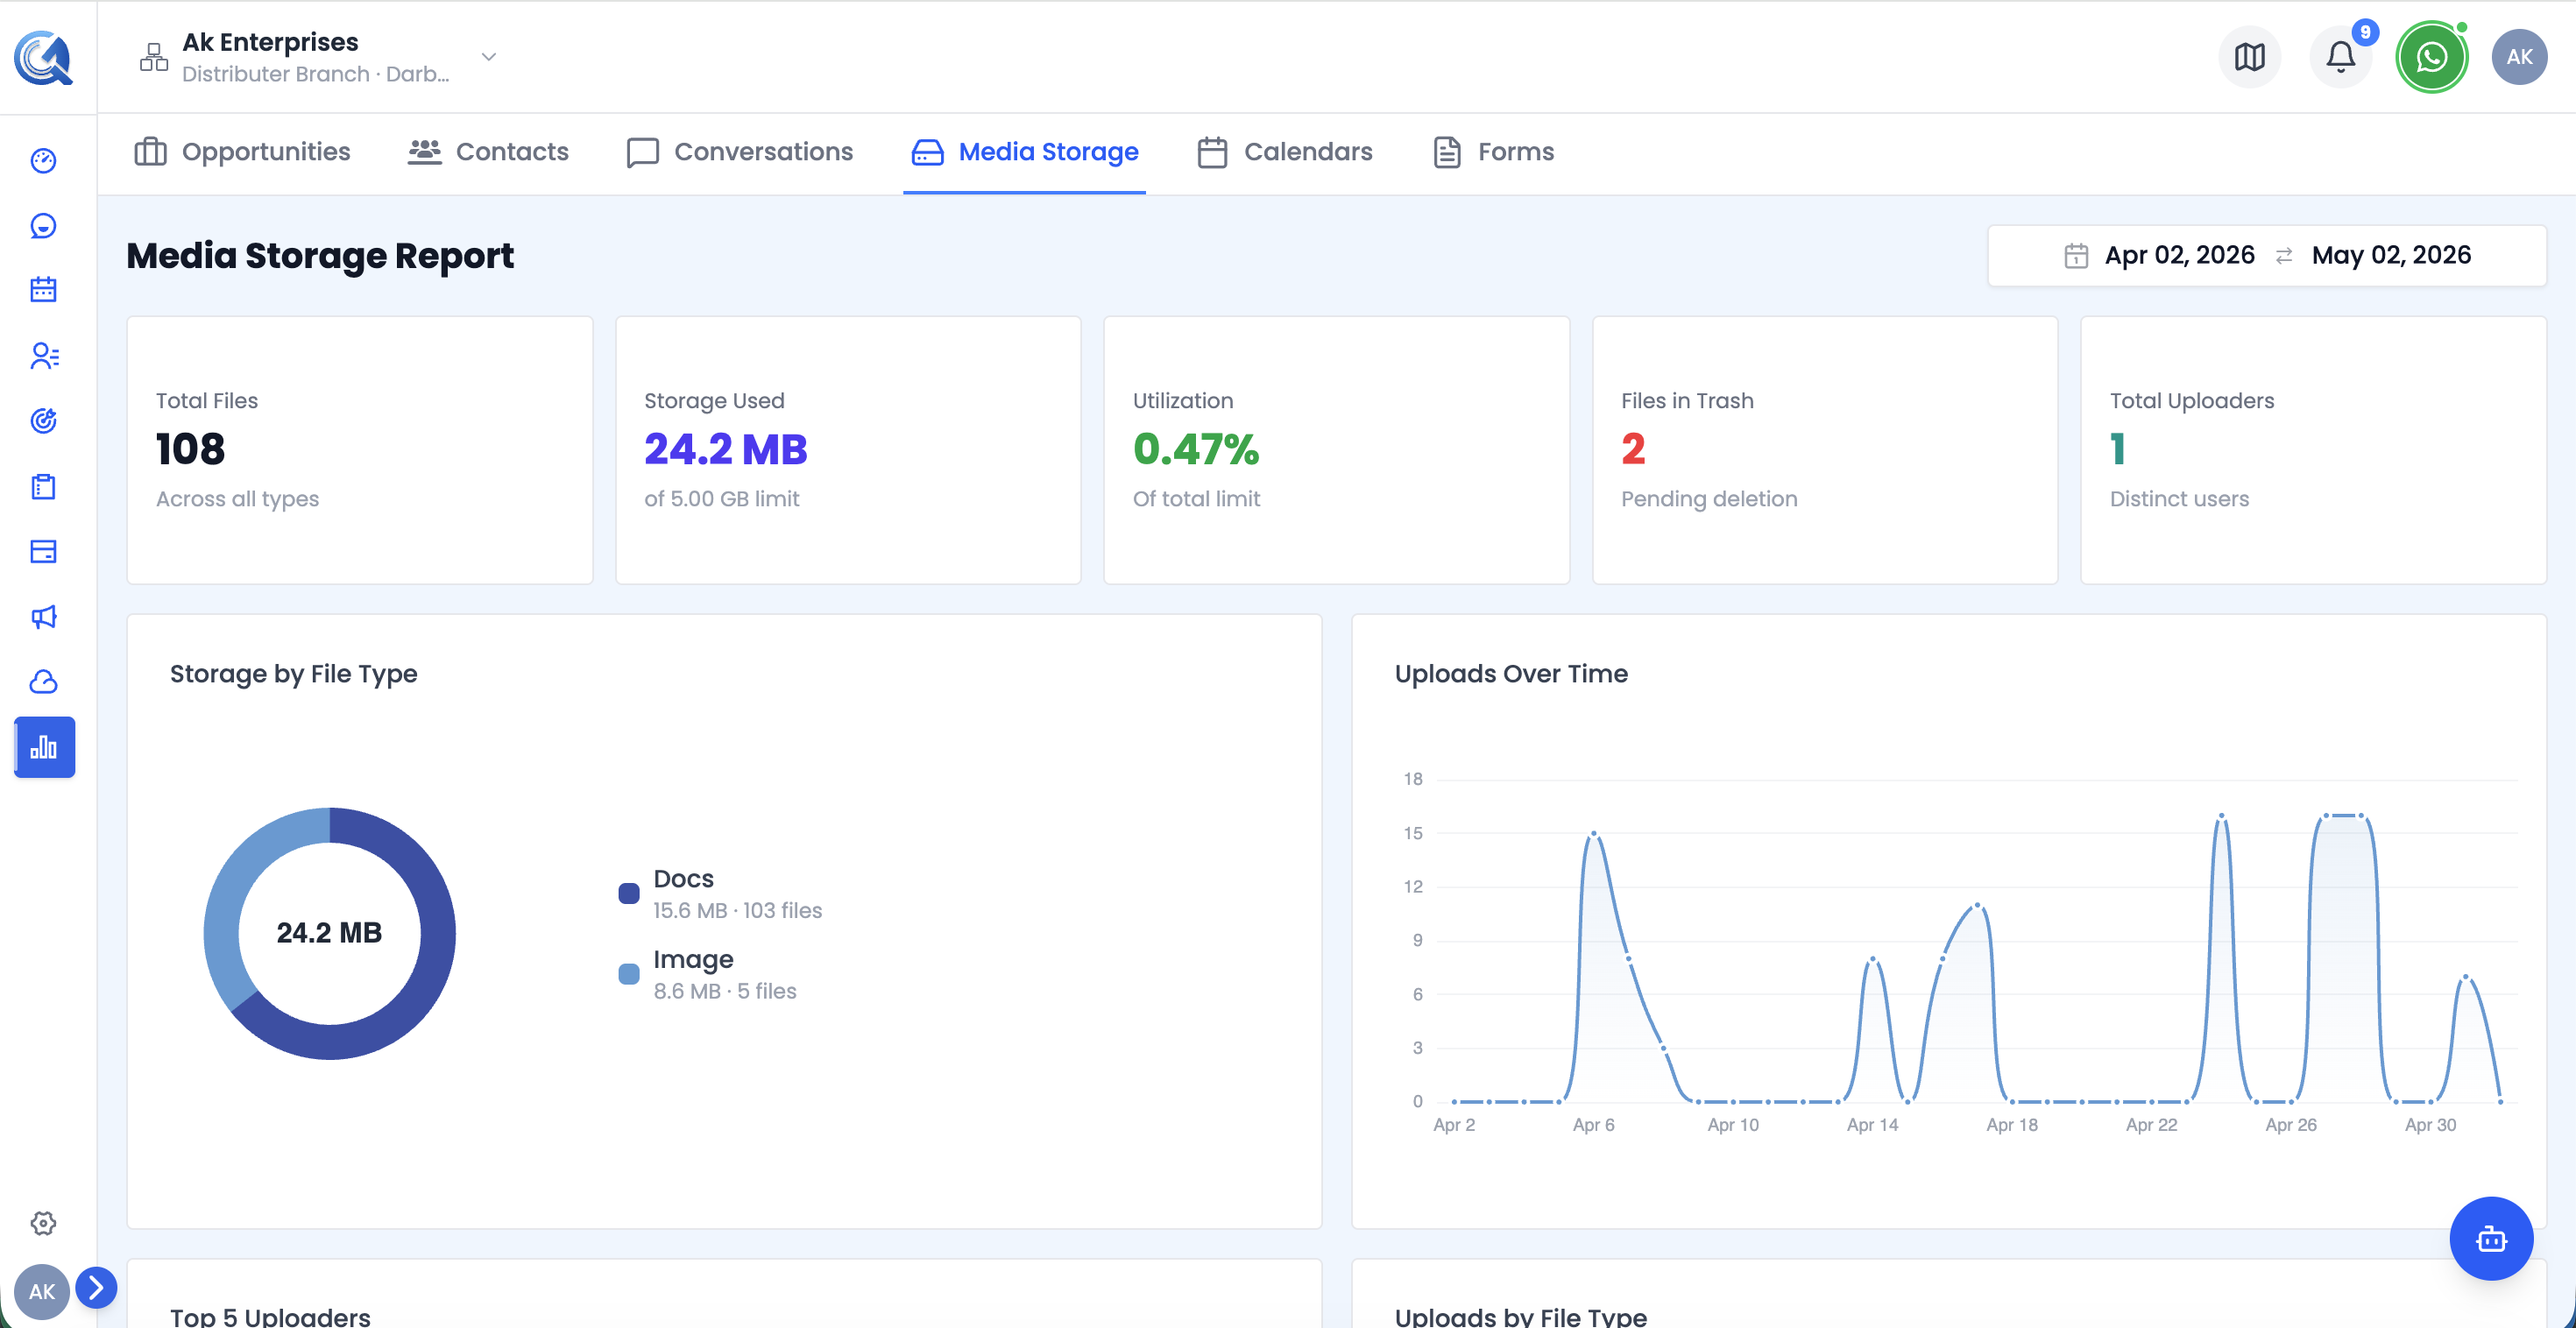 Top of the Media Storage report — KPI cards and storage-by-type donut.
Media Storage KPI Cards
Five metrics with colour-coded alerts:
| Card | What it shows |
|---|---|
| Total Files | All files currently in storage |
| Storage Used | Used vs. plan limit (e.g. "2.3 GB of 10 GB") |
| Utilization % | Red (>80%), yellow (50–80%), green (<50%) |
| Files in Trash | Count of deleted files — red if greater than zero |
| Total Uploaders | Number of distinct users who have uploaded files |
Storage by File Type Chart
A donut chart showing how storage is divided across file types — Image, Video, Audio, Docs, Other. The centre shows total storage used. The sidebar legend shows each type's storage size and file count.
Use this to identify which file categories are consuming the most quota and whether a cleanup is needed.
Video Walkthrough
Watch the complete walkthrough below.