Opportunities Report
The Opportunities report shows the health of your sales pipeline — deal counts, values by status, and exactly where deals are dropping off at each stage.
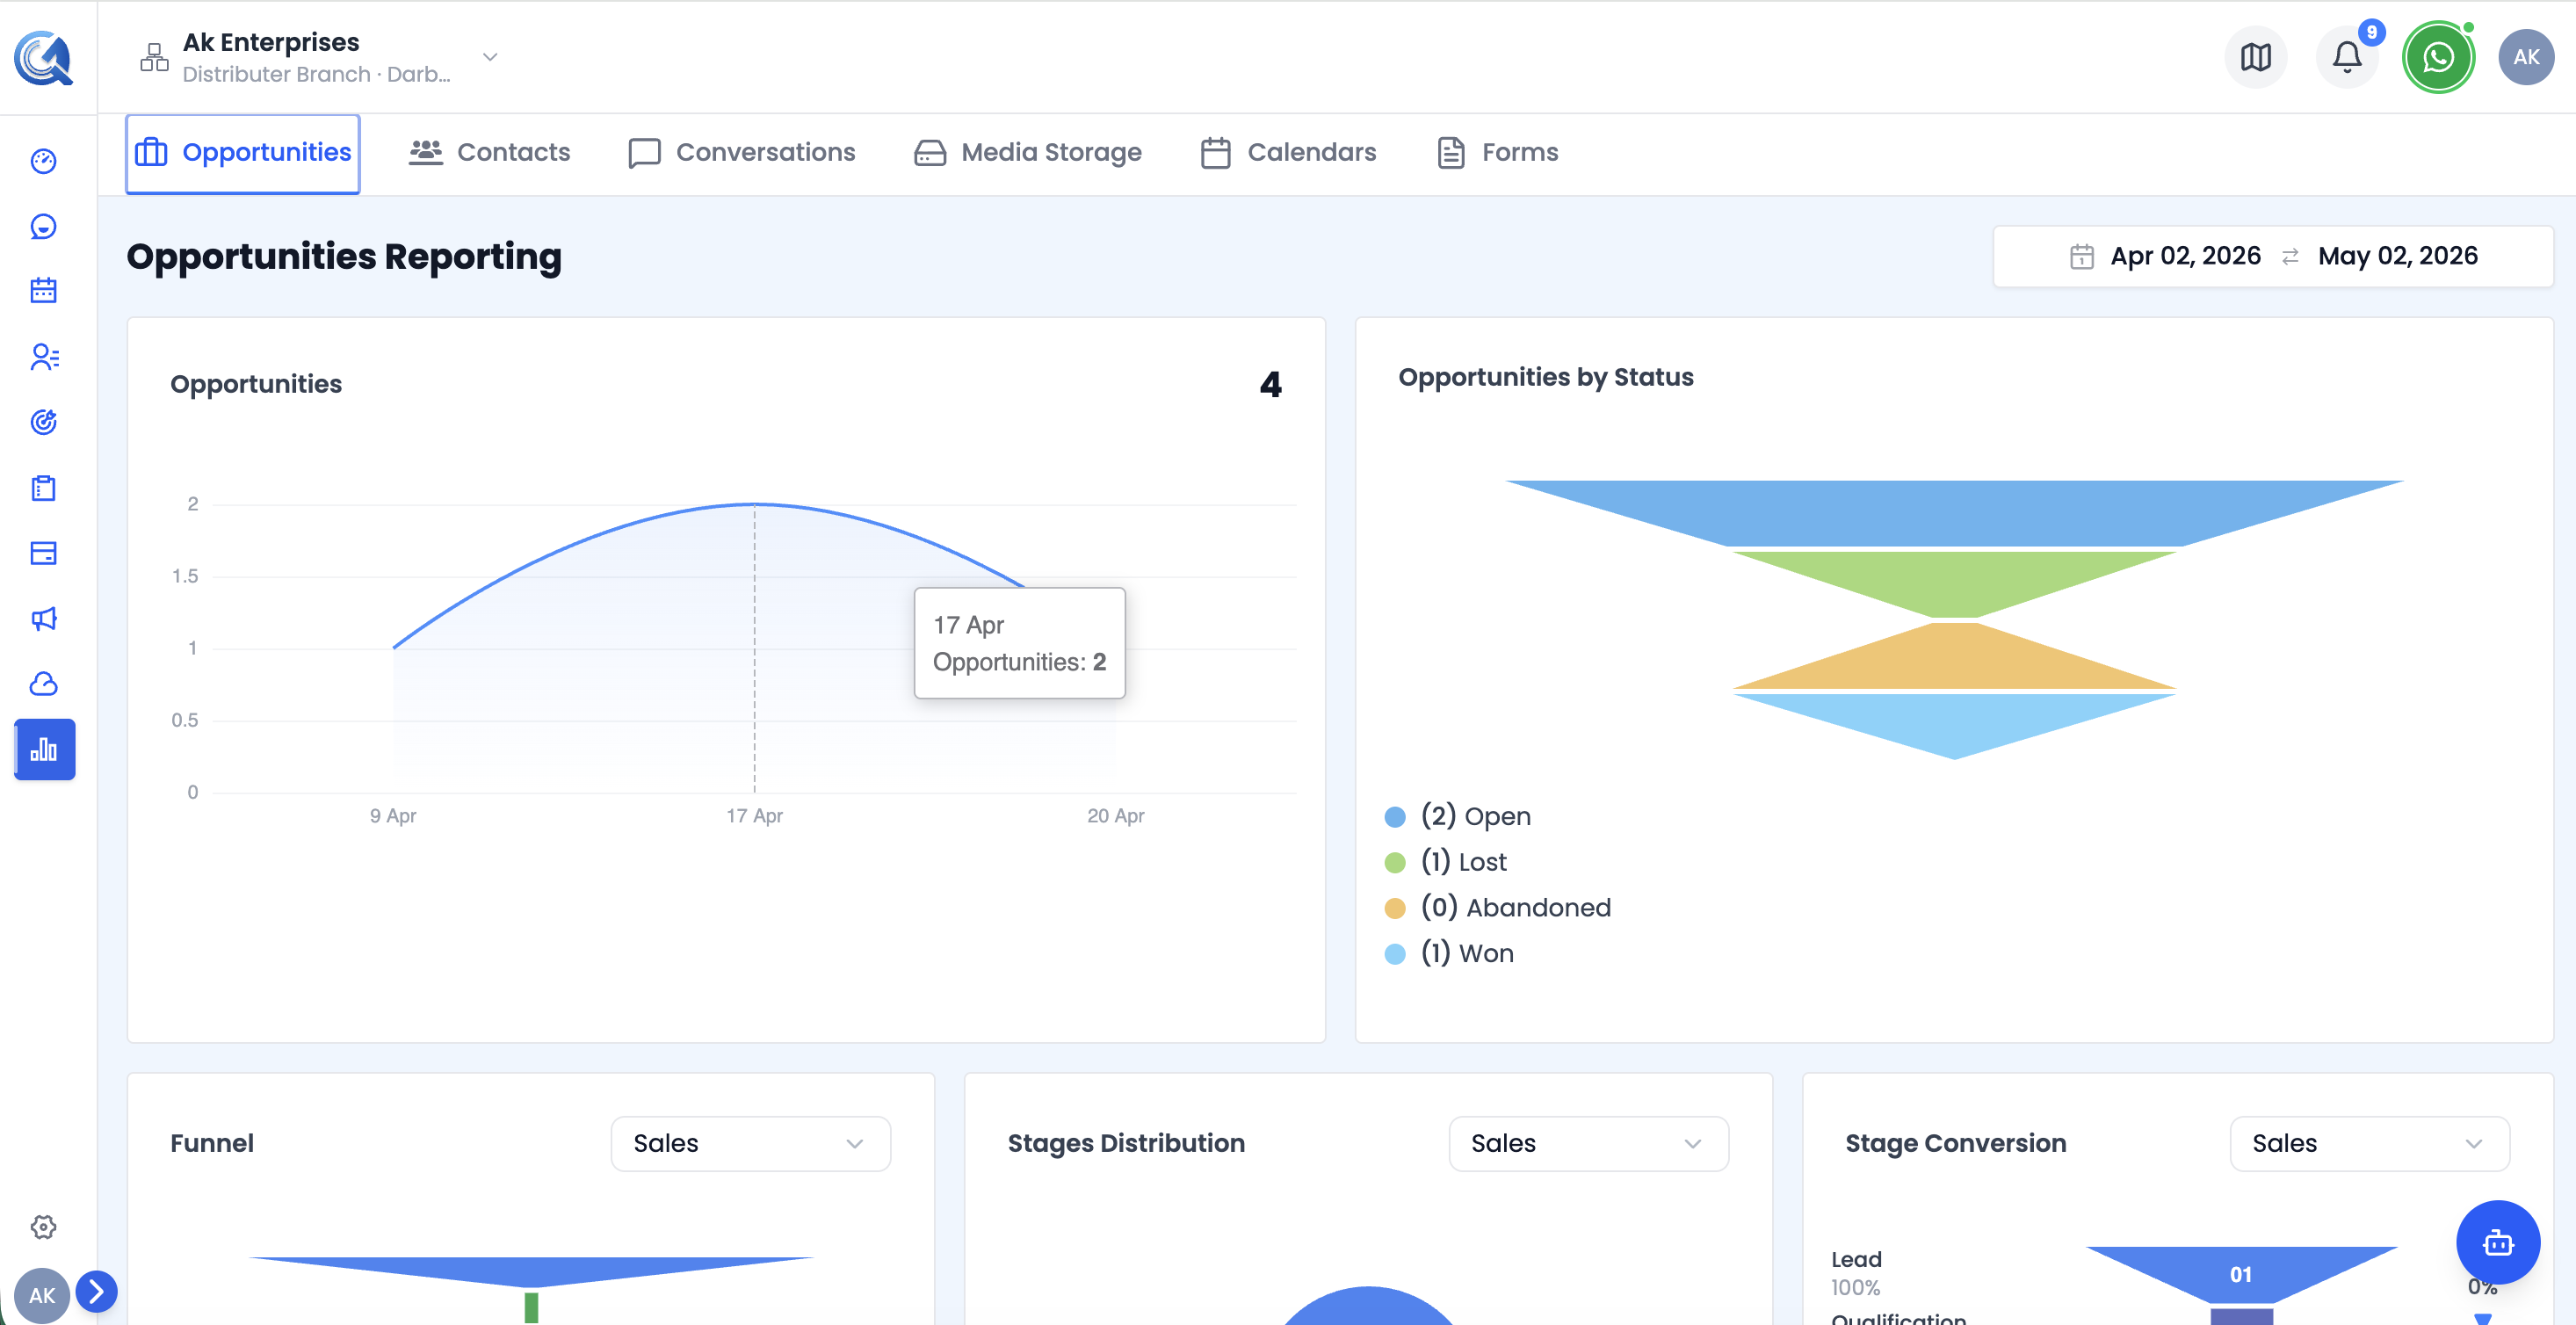 Top of the Opportunities report — three rows of KPI cards covering deal counts, values, and rates.
Opportunities KPI Cards
Three rows of metrics covering volume, value, and rates:
Row 1 — Count
| Card | What it shows |
|---|---|
| Opportunities | Total opportunities in the period |
| Won | Deals closed successfully |
| Open | Deals still active |
| Lost | Deals lost |
| Abandoned | Deals dropped without a decision |
Row 2 — Value (INR)
| Card | What it shows |
|---|---|
| Total Pipeline Value | Combined value of all deals |
| Amount Won | ₹ value of won deals |
| Amount Lost | ₹ value of lost deals |
| Amount Open | ₹ value of open deals |
| Amount Abandoned | ₹ value of abandoned deals |
Row 3 — Rates
| Card | What it shows |
|---|---|
| Win Rate | Won ÷ Total (%) |
| Avg Deal Size | Average ₹ value per deal |
Pipeline Funnel Chart
A stage-level funnel for a selected pipeline. Use the Pipeline dropdown to switch between pipelines. For each stage the chart shows the opportunity count, total ₹ value, and conversion rate from the previous stage.
Use this to understand how many deals are in each stage and the total value at risk.
Stage Conversion Chart
A three-panel funnel (with pipeline selector) showing conversion rates between consecutive stages:
- Left panel — stage names and cumulative conversion %
- Centre — funnel bars narrowing as conversion drops
- Right panel — step-by-step conversion % between each stage pair
Use this to pinpoint exactly where deals are falling out of your pipeline so you can focus coaching and follow-up efforts at those stages.
Video Walkthrough
Watch the complete walkthrough below.