Reports Overview
Reports is the analytics layer of Quantixone — a dedicated section with deep-dive charts, tables, and KPI breakdowns for every service. While the Dashboard gives you a live summary, Reports lets you analyse trends, compare periods, drill into individual records, and understand performance across Contacts, Conversations, Calendar, Opportunities, Forms, and Media Storage.
Navigating to Reports
From the main navigation, click Reports. The page opens to the first available report section. Use the section tabs or sidebar to switch between service reports.
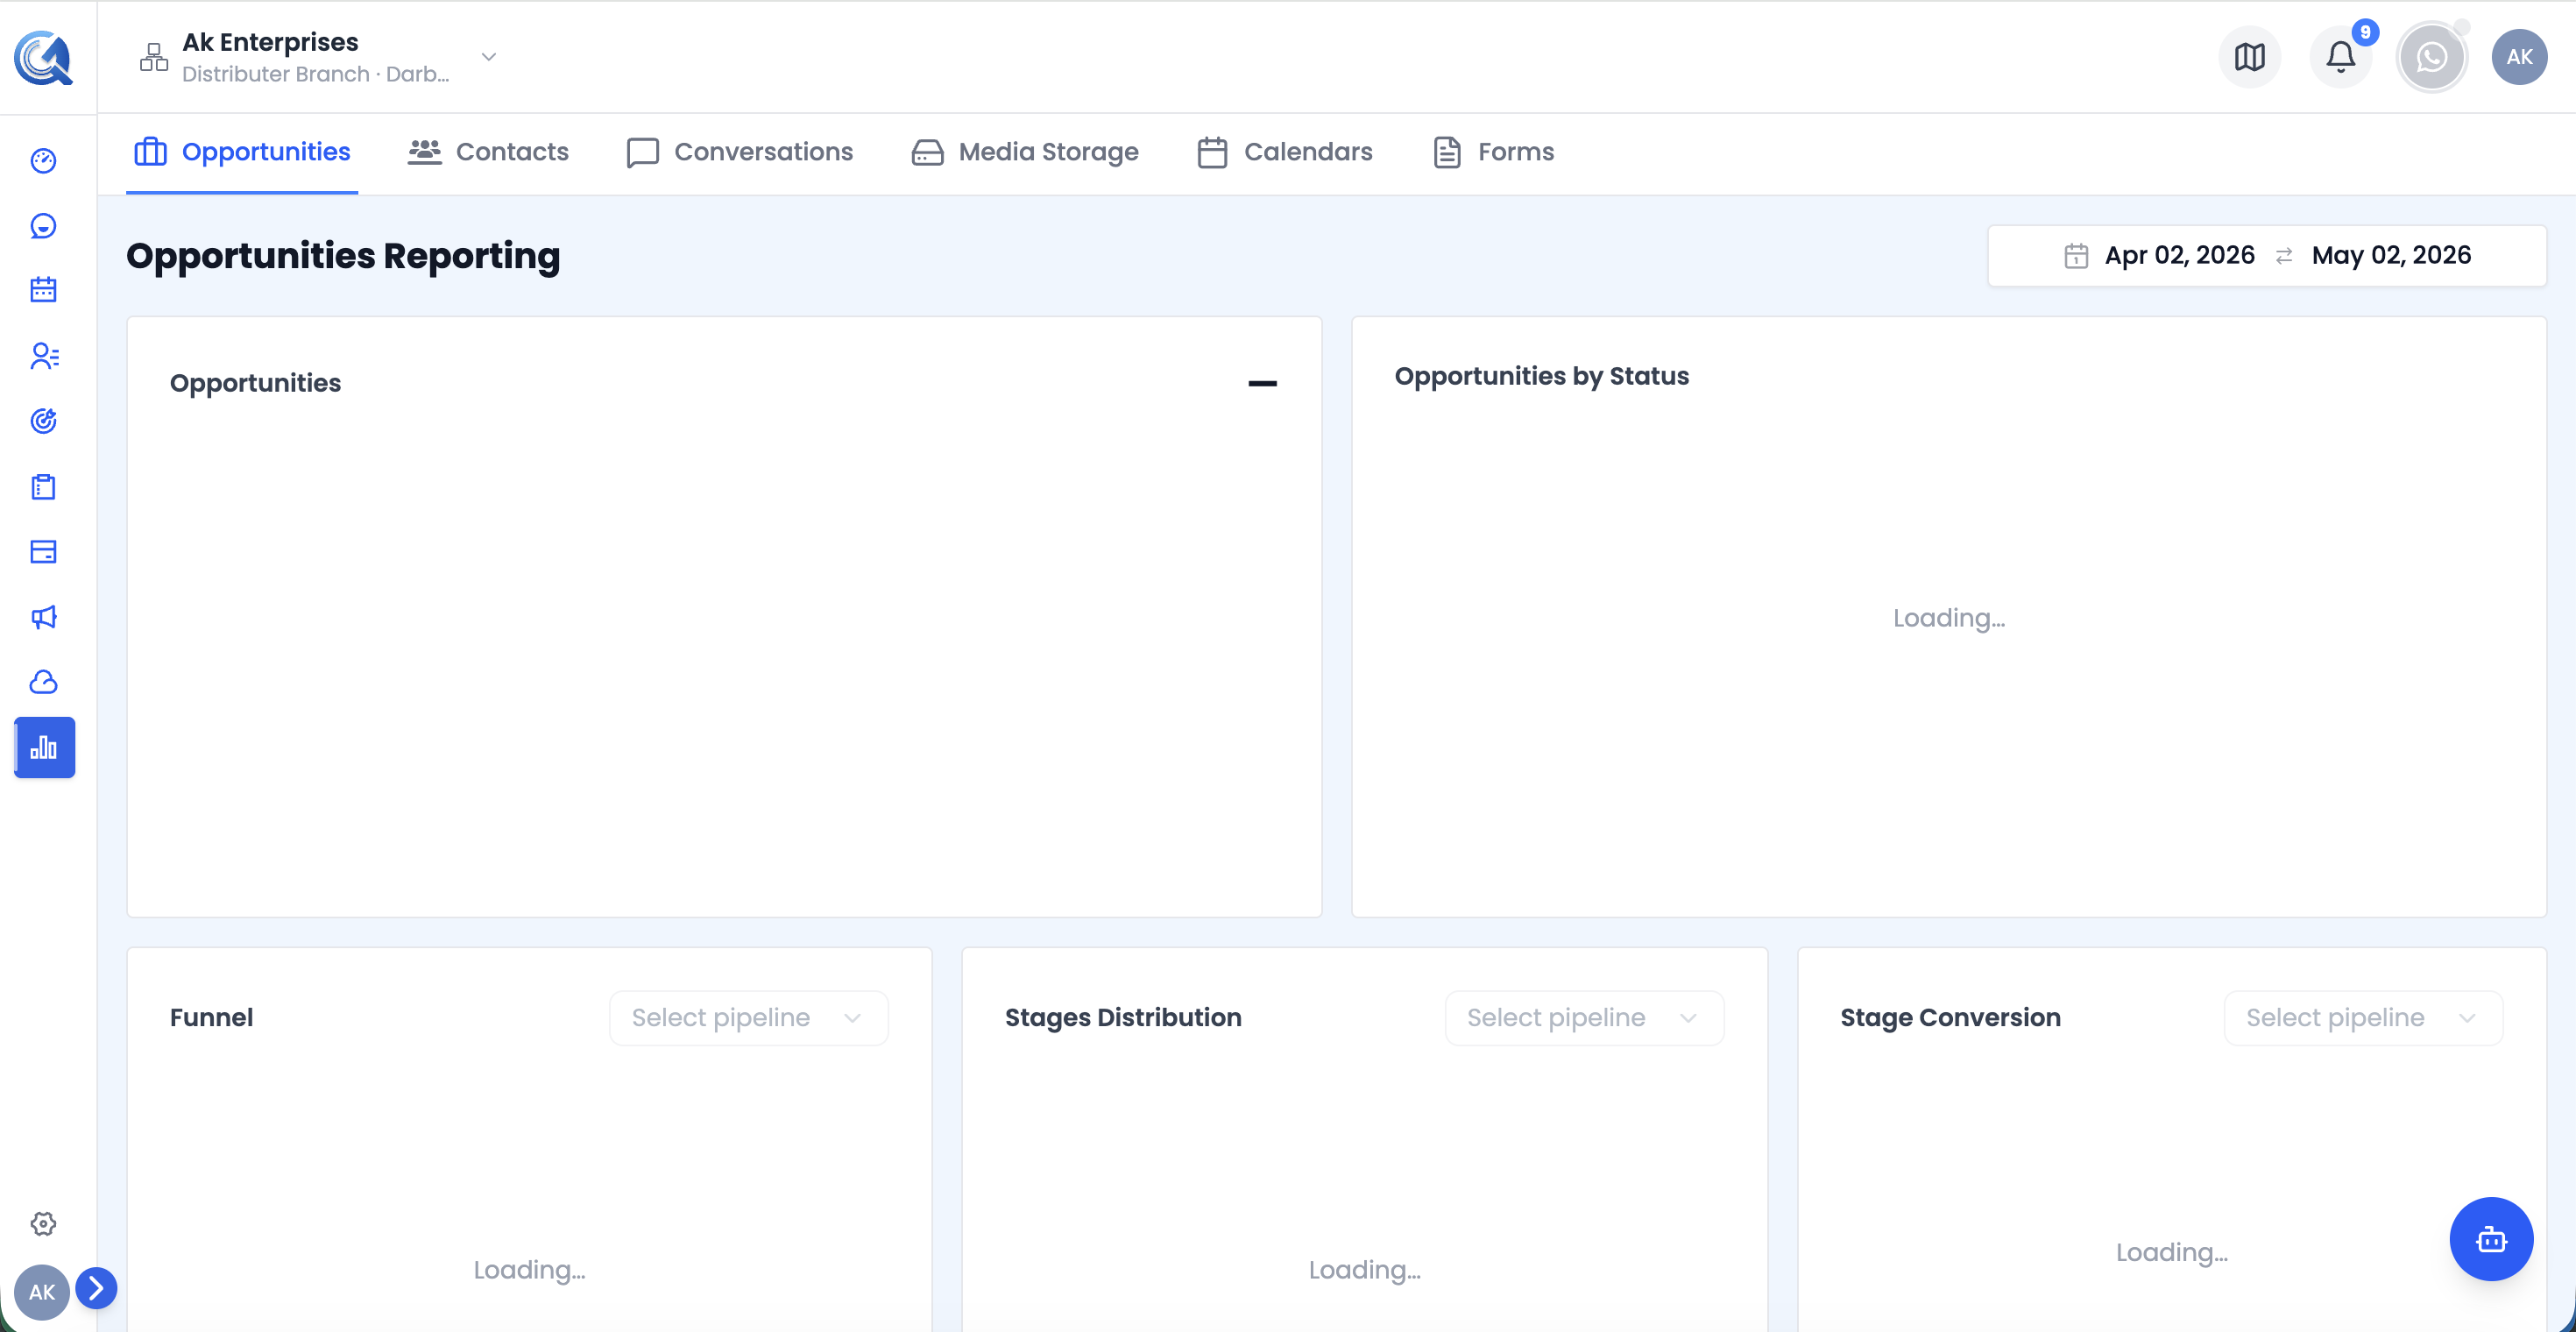 The Reports landing view. Use the section tabs to navigate between service reports.
Date Range Picker
All report sections share a Date Range Picker in the top-right corner. Changing the date range updates every chart and KPI card on the active section simultaneously.
- Default range: last 30 days
- Future dates are disabled
- Some charts (e.g. Overdue Tasks) are not date-filtered and always show current state
Report Sections
| Section | What it covers |
|---|---|
| Contacts | Contact growth, source breakdown, task metrics, leaderboard |
| Conversations | Message volume, channel distribution, delivery stats, cost, campaign performance |
| Calendar | Appointment trends, booking sources, team workload, popular days |
| Opportunities | Deal pipeline, stage conversion, value breakdown, top deals |
| Forms | Submission trends, form performance, popular days |
| Media Storage | Storage usage, upload trends, top uploaders, trash breakdown |
Video Walkthrough
Watch the complete walkthrough below.