Tasks Report
The Tasks report shows how your team is handling work across contacts and opportunities — completion rates, overdue load, and what's coming due next.
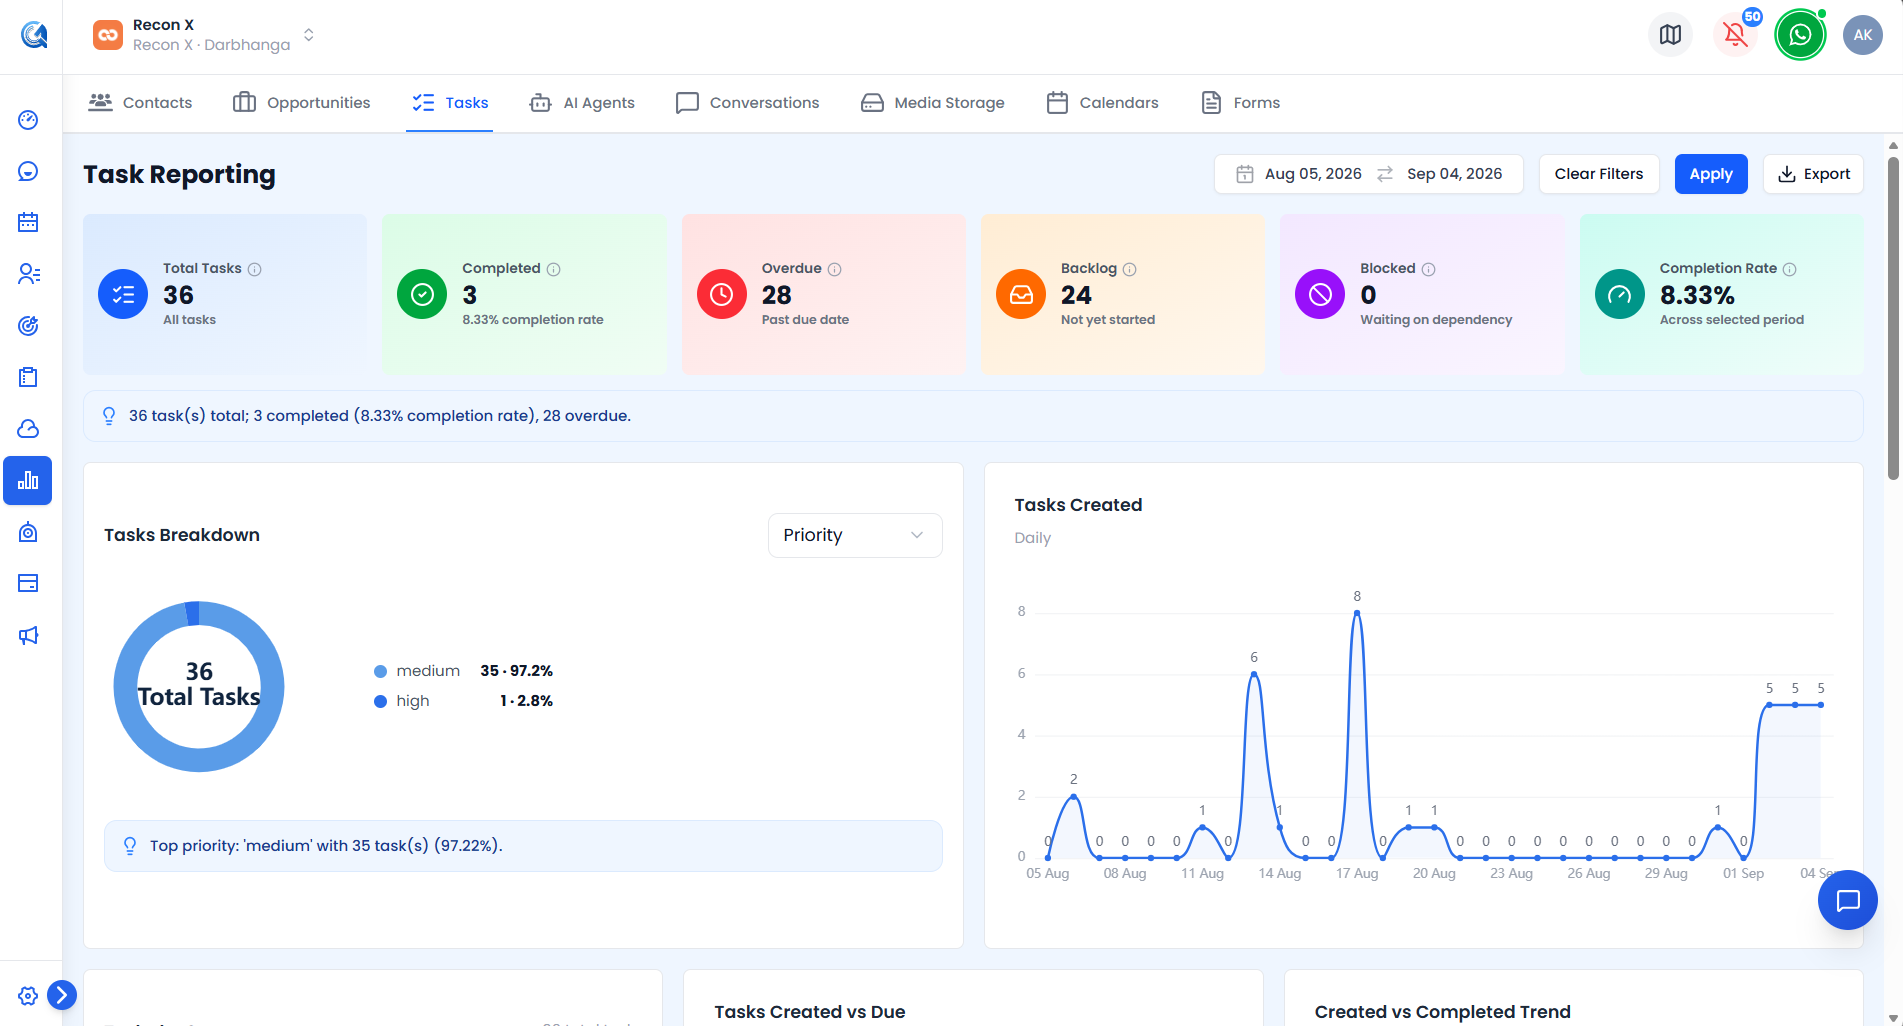 Top of the Tasks report — KPI cards and the Tasks Breakdown chart.
Filters
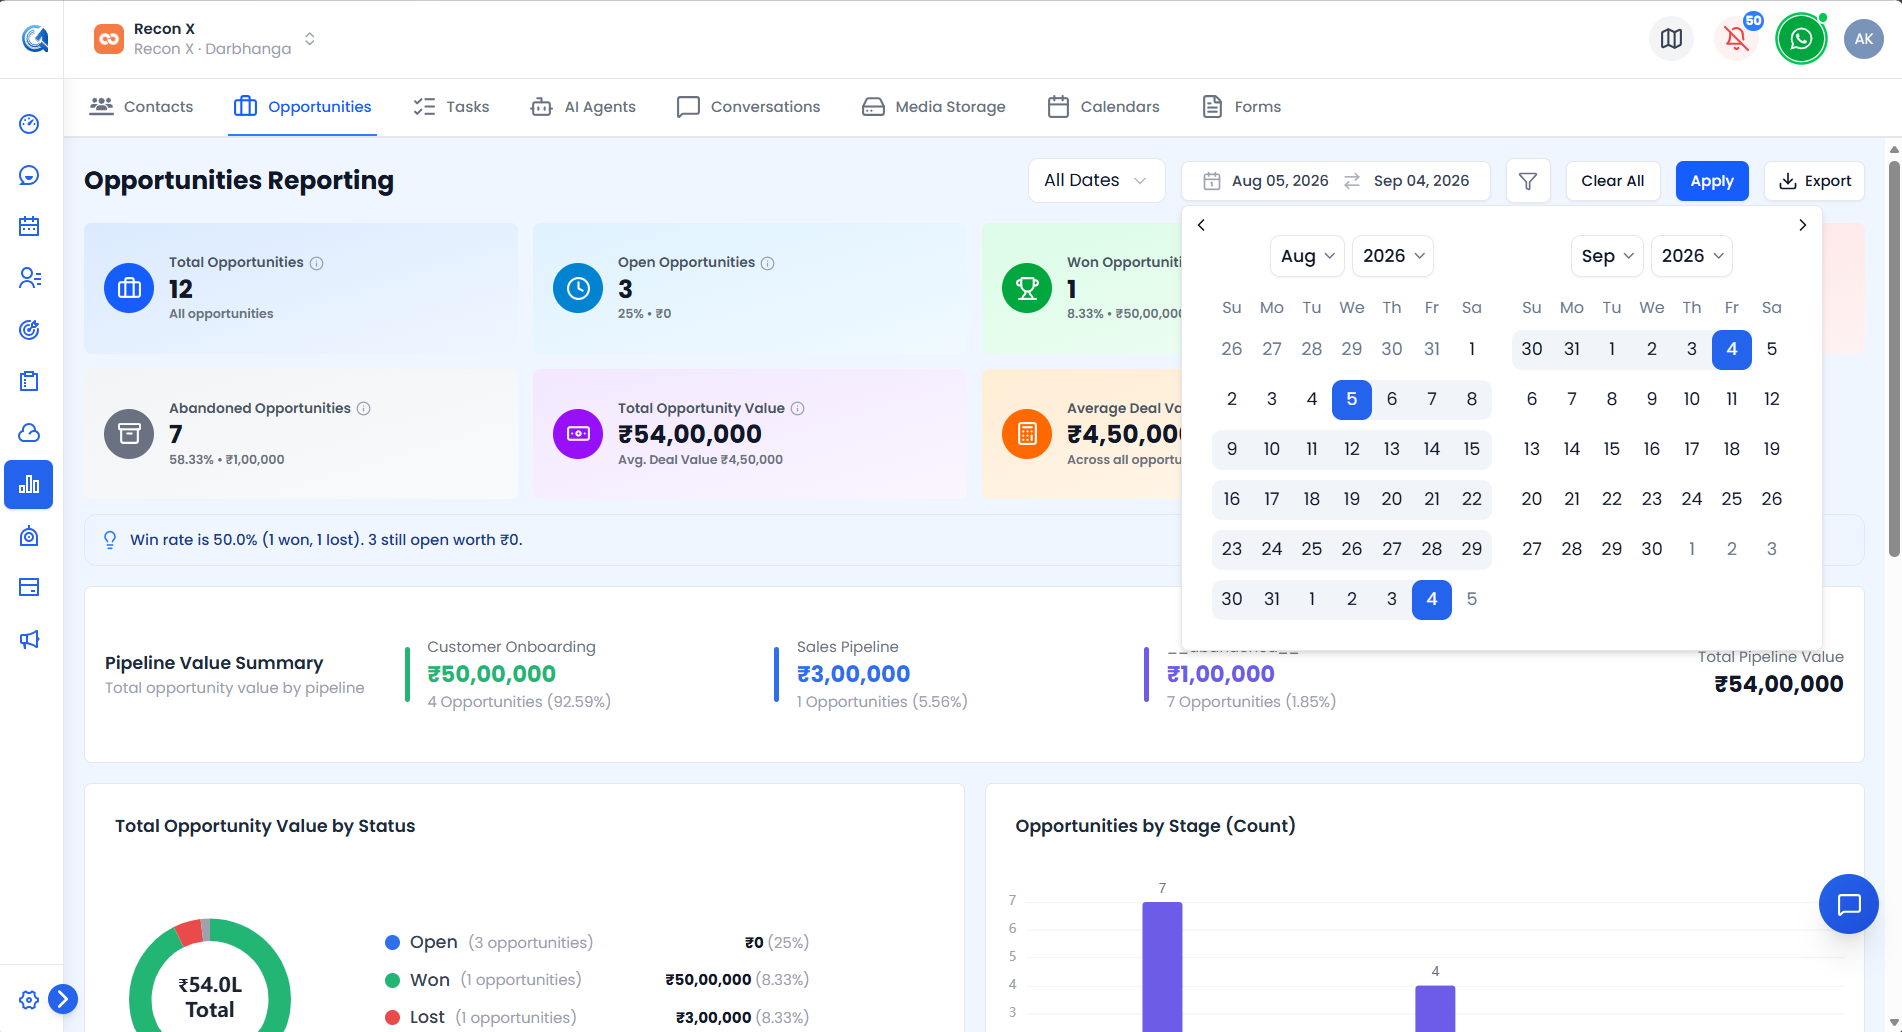 The Tasks report's Date Range Picker.
A Date Range Picker (default: last 30 days) is the only report-wide filter. Use Apply to run it or Clear Filters to reset. An Export CSV button downloads the currently filtered view.
Tasks KPI Cards
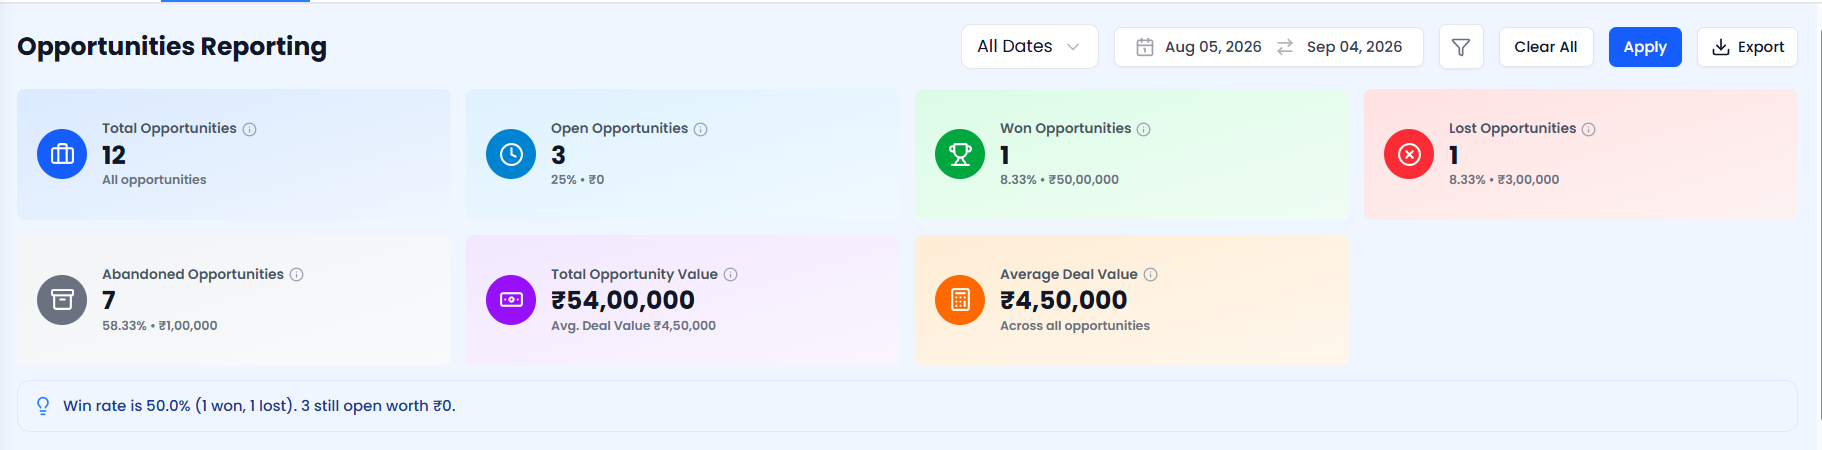 The Tasks KPI cards and the insight banner below them.
| Card | What it shows |
|---|---|
| Total Tasks | All tasks matching the date range |
| Completed | Tasks completed, plus completion rate |
| Overdue | Tasks past their due date and still open |
| Backlog | Open tasks not yet due |
| Blocked | Tasks marked blocked |
| Completion Rate | Completed ÷ Total (%) |
An insight banner below the cards highlights a notable trend when one is available.
Tasks Breakdown Chart
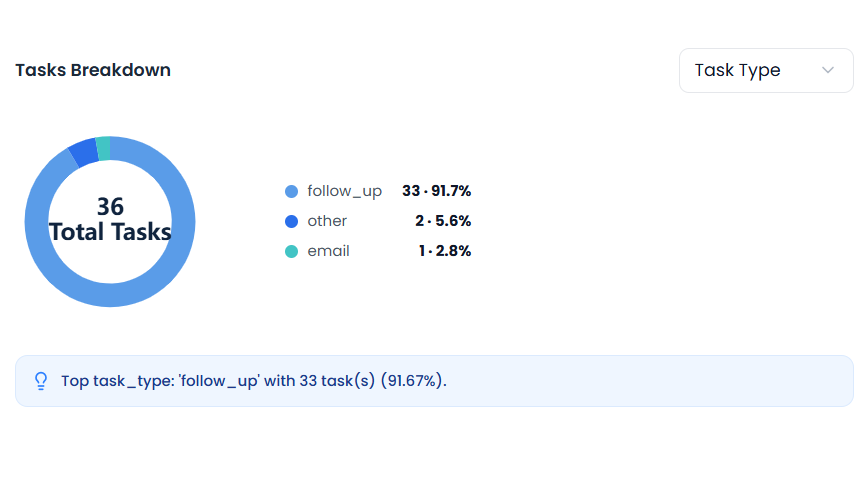 The Tasks Breakdown chart with its dimension selector.
A donut chart with a dimension selector — Priority / Task Type / Assigned To / Record Type (default: Priority). Shows the top 10 values with the total in the centre, and its own insight callout.
Use this to see where task volume concentrates by whichever dimension matters most to you.
Tasks Trend Chart
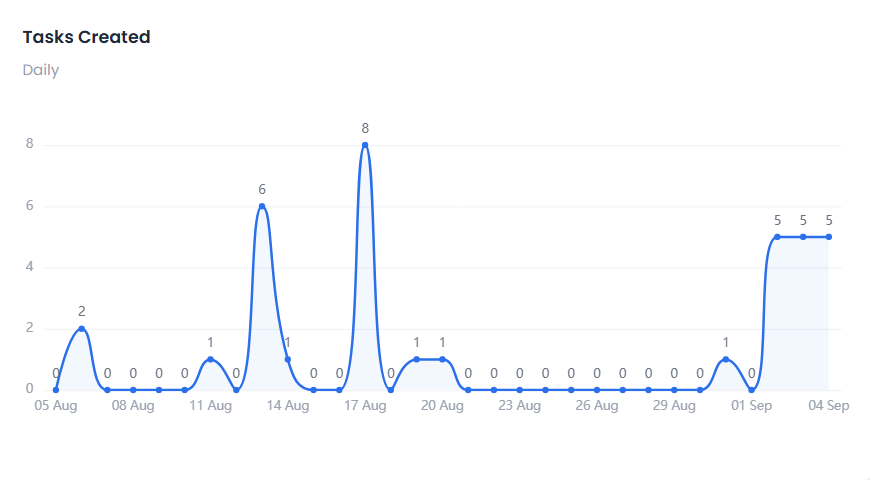 The Tasks Trend chart.
A line chart trending task volume over time.
Use this to spot spikes or slow periods in overall task activity.
Tasks by Status Chart
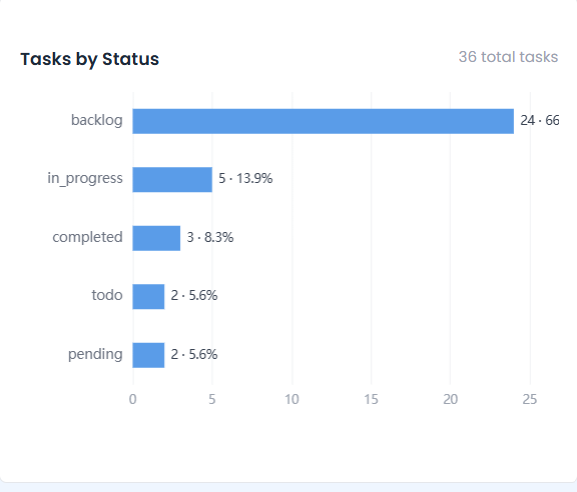 The Tasks by Status chart.
A breakdown of tasks by their current status.
Use this to see the overall shape of your team's task pipeline at a glance.
Created vs Due Trend Chart
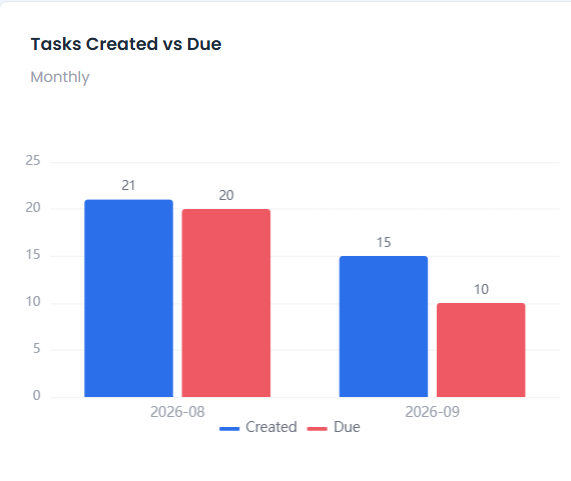 The Created vs Due Trend chart.
A line chart comparing tasks created against tasks due over time.
Use this to see whether your team is creating tasks faster than it can close them.
Tasks Completion Trend Chart
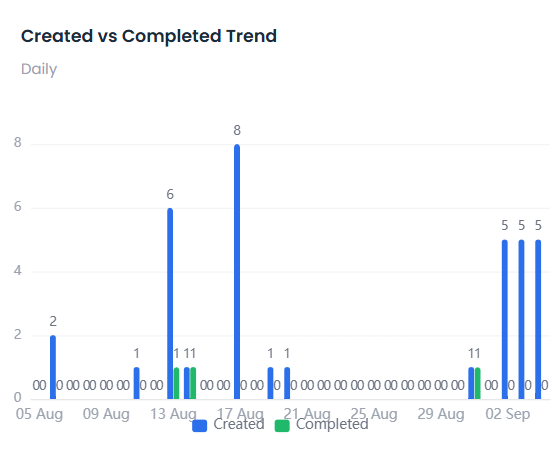 The Tasks Completion Trend chart.
A line chart trending completion rate over time.
Use this to track whether task throughput is improving or slipping.
Task Summary by Record
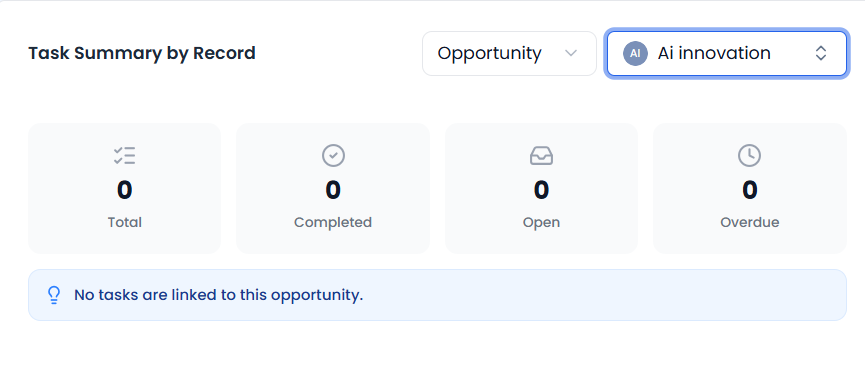 The Task Summary by Record panel with the record-type and search selectors.
Pick a record type (Contact or Opportunity), then search for a specific record. Until a record is selected, this section shows "Select a contact or opportunity to see its tasks." Once selected, it shows Total, Completed, Open, and Overdue tiles for that record, plus an insight.
Use this to review task load for one specific contact or opportunity.
Tasks Due Soon by Record
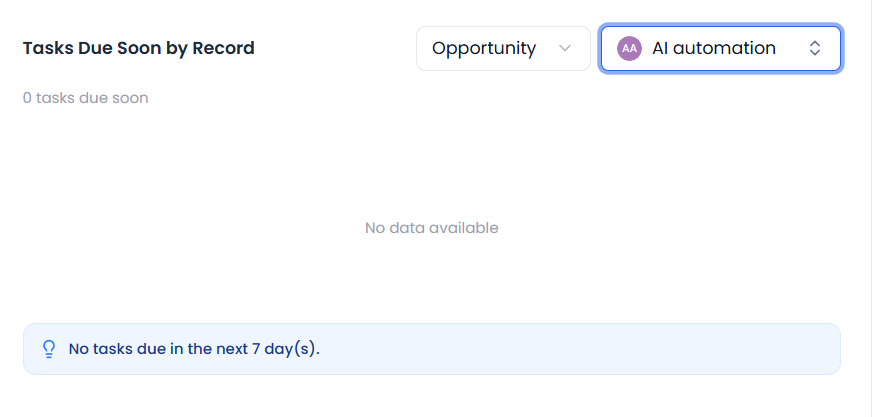 The Tasks Due Soon by Record chart.
The same record-type and search pattern as above; shows a horizontal bar of assignees with a "X tasks due soon" subtitle for the selected record.
Use this to see who to follow up with for tasks coming due on a specific record.
Tasks Leaderboard Table
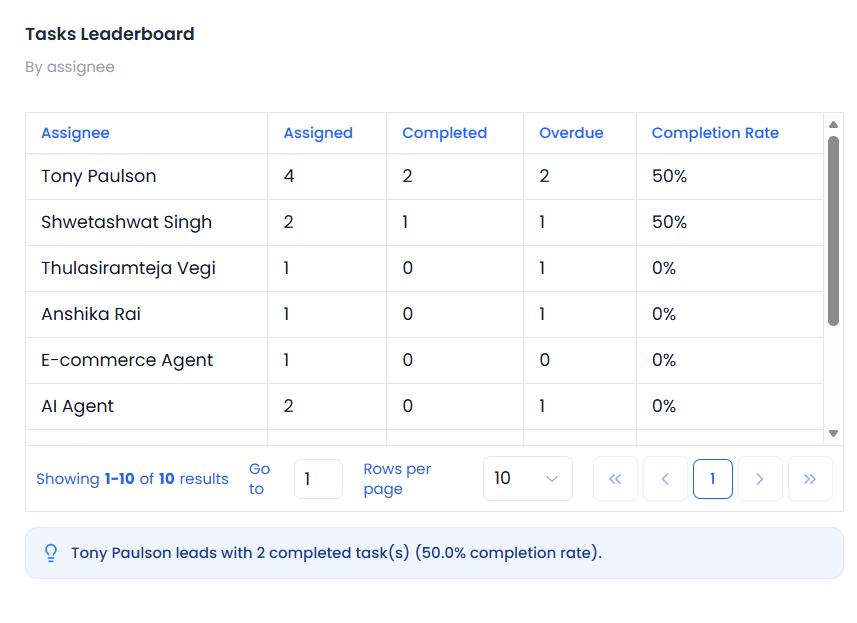 The Tasks Leaderboard table.
| Column | Description |
|---|---|
| Assignee | Team member name |
| Total Assigned | Tasks assigned to them |
| Completed | Tasks they completed |
| Overdue | Tasks currently overdue |
| Completion Rate | Completed ÷ Assigned (%) |
Sortable by any column.
Tasks Due Soon Chart
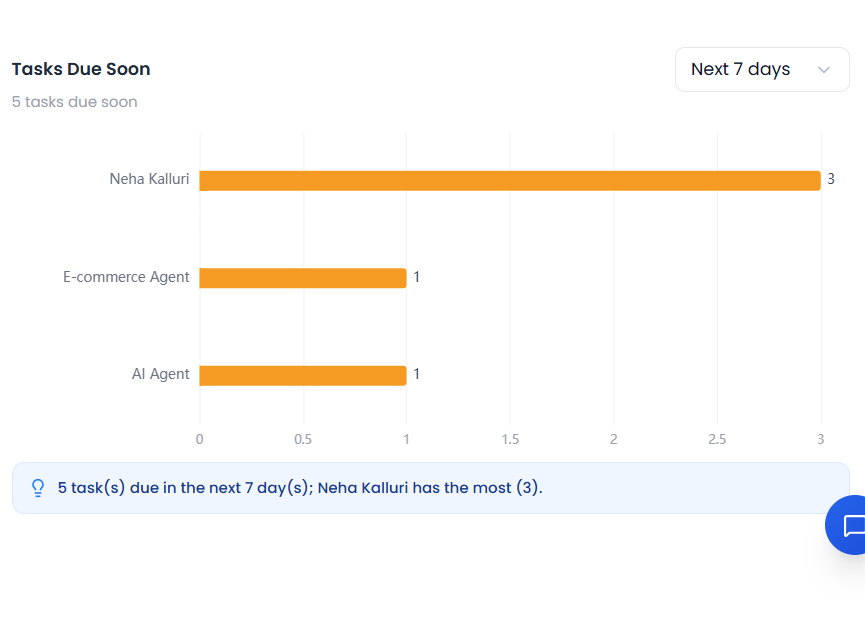 The Tasks Due Soon chart with its days-window selector.
A horizontal bar chart by assignee, with its own days-window selector — Next 3 / 7 / 14 / 30 days (default: 7) — independent of the report's date range.
Use this to plan short-term follow-up regardless of the report's overall date range.
Video Walkthrough
Watch the complete walkthrough below.